
Homework Answers
a) The null hypothesis is 

(where 

b) Type-I error:
In this problem type-I error is the error generated due to rejecting the null hypothesis based on the sample information i.e. concluding that the average success using online HW is different when actually the average success using online HW is not significantly different for the population.
Type-II error:
In this problem type-II error is the error generated due to accepting the null hypothesis based on the sample information i.e. concluding that the average success using online HW is not different when actually the average success using online HW is significantly different for the population.
c) (Assuming the two population standard deviations are the same because the two given sample standard deviations are same and we know that, sample standard deviations are the good unbiased estimators of population standard deviations)
The sample statistic for this test is 
where 


Let the population standard deviation for both the samples
is 
(Assuming the samples are from 

We know 


i.e. 
Now under 

And we know 

So, 
So under 

So the sample statistic follows t distribution with degrees of
freedom 
Here the value of the sample statistic is 
d) Here p-value is the probability of the
sample statistic being more extreme than the calculated value of
it, i.e. the probability of 
The p-value of the test is,


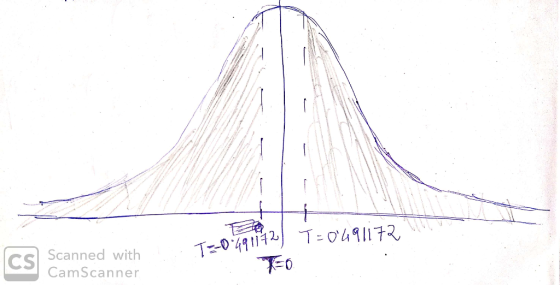
The above probability represents the shaded area is the picture.
e) In this test, we failed to reject the null
hypothesis based on the sample information since the p-value of the
test is greater than the given significance level

Add Answer to:
Please show work
2.) Which is better for student learning - online HW or handwritten HW?...
Please show work 1) Danny LOVES watching his Warriors & Sharks play, but watching 82 games...
 Please show work
1) Danny LOVES watching his Warriors & Sharks play, but watching 82 games x 2 teams can take away a lot of his free time! Suppose he is interested in whether Warriors or Sharks games are longer, so he takes a random sample of each team's games and records the games lengths. Conduct a test at the 5% level to determine if the average length of a Warriors game is different from that of a Sharks game....
Please show work
1) Danny LOVES watching his Warriors & Sharks play, but watching 82 games x 2 teams can take away a lot of his free time! Suppose he is interested in whether Warriors or Sharks games are longer, so he takes a random sample of each team's games and records the games lengths. Conduct a test at the 5% level to determine if the average length of a Warriors game is different from that of a Sharks game....
Show all work please 1. Certain standardized math exams have a mean of 100 and a...
Show all work please 1. Certain standardized math exams have a mean of 100 and a standard deviation of 60. Of a sample of 36 students who take this exam, what percent could you expect to score between 100 and 120? A)50 B)47.5 C)97.5 D)49.85 2.Certain standardized math exams have a mean of 100 and a standard deviation of 60. Of a sample of 36 students who take this exam, what percent could you expect to score above 120? A)2.5...
Please show work 9.) Are a person's college & the photo -upload ing site s/he chooses...
 Please show work
9.) Are a person's college & the photo -upload ing site s/he chooses independent? Below is a list of randomly sampled college students who were asked which of the following photo-uploading site s/he most prefers. Our goal is to determine whether these two variables are dependent. Let = 0.1 Instagram G0ogle+ Facebook Observed Foothill 21 10 13 De Anza 21 12 12 5 SJSU 16 7 a) State the null & alternative hypotheses, in the context of...
Please show work
9.) Are a person's college & the photo -upload ing site s/he chooses independent? Below is a list of randomly sampled college students who were asked which of the following photo-uploading site s/he most prefers. Our goal is to determine whether these two variables are dependent. Let = 0.1 Instagram G0ogle+ Facebook Observed Foothill 21 10 13 De Anza 21 12 12 5 SJSU 16 7 a) State the null & alternative hypotheses, in the context of...
A company offering online speed reading courses claims that students who take their courses show a...
A company offering online speed reading courses claims that students who take their courses show a 5 times (500%) increase in the number of words they can read in a minute without losing comprehension. A random sample of 100 students yielded an average increase of 412% with a standard deviation of 218%. We want to assess the companies’ claim. (a) Perform a hypothesis test evaluating if the company’s claim is reasonable. Make sure to interpret your response in the context...
A sample of 250 students who were taking online courses were asked to describe their overall...
A sample of 250 students who were taking online courses were asked to describe their overall impression of online learning on a scale of 1-7 with 7 representing the most favorable impression. The average score was 4.98 and the standard deviation was 0.87. Construct a 90% confidence interval for the mean score. Round your final answers to 3 decimal places. The 90% confidence interval for the mean score is: ( , )
heres a better picture 132 /texttornework 2001) Draw the Distribution and mark off your ample means....
 heres a better picture
132 /texttornework 2001) Draw the Distribution and mark off your ample means. Conspite the Test Statistic: Calculate the p value • Do you Reject the H or Fail to Reject the H.? • Write out a statement describing your conclustion. 2.2 Confidence Interval High school students who take the SAT mathematics exam a second time generally score higher than on their first attempt. The change in score has a Normal distribution with a standard deviation y...
heres a better picture
132 /texttornework 2001) Draw the Distribution and mark off your ample means. Conspite the Test Statistic: Calculate the p value • Do you Reject the H or Fail to Reject the H.? • Write out a statement describing your conclustion. 2.2 Confidence Interval High school students who take the SAT mathematics exam a second time generally score higher than on their first attempt. The change in score has a Normal distribution with a standard deviation y...
please show work and/or sketch of graph. Thanks A popular online retail website was interested in...
 please show work and/or sketch of graph. Thanks
A popular online retail website was interested in consumer spending during the holiday shopping weekend after Thanksgiving. They collect data on a random sample of 400 shoppers, particularly noting how much money each shopper spent. The following histogram was constructed using the data: 50 100 200 250 300 150 Spending The retailer determines that this sample had an average of $84.71 with a standard deviation of $46.87. a. (1 point) What is...
please show work and/or sketch of graph. Thanks
A popular online retail website was interested in consumer spending during the holiday shopping weekend after Thanksgiving. They collect data on a random sample of 400 shoppers, particularly noting how much money each shopper spent. The following histogram was constructed using the data: 50 100 200 250 300 150 Spending The retailer determines that this sample had an average of $84.71 with a standard deviation of $46.87. a. (1 point) What is...
D Question 25 4 pts The average age of online consumers a few years ago was...
 D Question 25 4 pts The average age of online consumers a few years ago was 23.3 years. As older individuals gain confidence and trust in theinternet, it is believed that the average age has increased. To test this belief, we selected a random sample of 40 individuals who have made an online purchase this year. The online shoppers in our sample had an average age of 25.2 years, with a standard deviation of 5.3 years. The P-value associated with...
show work please Problem 2: Use the following to answer questions a)-e): A random sample of...
 show work please
Problem 2: Use the following to answer questions a)-e): A random sample of 48 students at a large university reported getting an average of 7 hours of sleep on weeknights, with standard deviation 1.62 hours. A dotplot of the data is provided. 9.6 Weekniaht Sleep a. Briefly explain why it is reasonable to use a t-distribution to perform inference about the mean amount of weeknight sleep for students at this university. (2 points) The research question: It...
show work please
Problem 2: Use the following to answer questions a)-e): A random sample of 48 students at a large university reported getting an average of 7 hours of sleep on weeknights, with standard deviation 1.62 hours. A dotplot of the data is provided. 9.6 Weekniaht Sleep a. Briefly explain why it is reasonable to use a t-distribution to perform inference about the mean amount of weeknight sleep for students at this university. (2 points) The research question: It...
E Section 3: 2 Scores/Percentiles and Hypothesis Testing Please show work. You wil need to refer ...
 e Section 3: 2 Scores/Percentiles and Hypothesis Testing Please show work. You wil need to refer to Z score tables for this rtin 6. The national (population) average for ACT scores is 208 (on a 36 point a. Suppose you score 26 on does this score fall? (Find your ACT. At approximately what percentile (round to the nearest integer between 1 and 99) your probability from the Z table, subtract that from 1, multiply by 100, and round) Answer that...
 Please show work
1) Danny LOVES watching his Warriors & Sharks play, but watching 82 games x 2 teams can take away a lot of his free time! Suppose he is interested in whether Warriors or Sharks games are longer, so he takes a random sample of each team's games and records the games lengths. Conduct a test at the 5% level to determine if the average length of a Warriors game is different from that of a Sharks game....
Please show work
1) Danny LOVES watching his Warriors & Sharks play, but watching 82 games x 2 teams can take away a lot of his free time! Suppose he is interested in whether Warriors or Sharks games are longer, so he takes a random sample of each team's games and records the games lengths. Conduct a test at the 5% level to determine if the average length of a Warriors game is different from that of a Sharks game....
 Please show work
9.) Are a person's college & the photo -upload ing site s/he chooses independent? Below is a list of randomly sampled college students who were asked which of the following photo-uploading site s/he most prefers. Our goal is to determine whether these two variables are dependent. Let = 0.1 Instagram G0ogle+ Facebook Observed Foothill 21 10 13 De Anza 21 12 12 5 SJSU 16 7 a) State the null & alternative hypotheses, in the context of...
Please show work
9.) Are a person's college & the photo -upload ing site s/he chooses independent? Below is a list of randomly sampled college students who were asked which of the following photo-uploading site s/he most prefers. Our goal is to determine whether these two variables are dependent. Let = 0.1 Instagram G0ogle+ Facebook Observed Foothill 21 10 13 De Anza 21 12 12 5 SJSU 16 7 a) State the null & alternative hypotheses, in the context of...
 heres a better picture
132 /texttornework 2001) Draw the Distribution and mark off your ample means. Conspite the Test Statistic: Calculate the p value • Do you Reject the H or Fail to Reject the H.? • Write out a statement describing your conclustion. 2.2 Confidence Interval High school students who take the SAT mathematics exam a second time generally score higher than on their first attempt. The change in score has a Normal distribution with a standard deviation y...
heres a better picture
132 /texttornework 2001) Draw the Distribution and mark off your ample means. Conspite the Test Statistic: Calculate the p value • Do you Reject the H or Fail to Reject the H.? • Write out a statement describing your conclustion. 2.2 Confidence Interval High school students who take the SAT mathematics exam a second time generally score higher than on their first attempt. The change in score has a Normal distribution with a standard deviation y...
 please show work and/or sketch of graph. Thanks
A popular online retail website was interested in consumer spending during the holiday shopping weekend after Thanksgiving. They collect data on a random sample of 400 shoppers, particularly noting how much money each shopper spent. The following histogram was constructed using the data: 50 100 200 250 300 150 Spending The retailer determines that this sample had an average of $84.71 with a standard deviation of $46.87. a. (1 point) What is...
please show work and/or sketch of graph. Thanks
A popular online retail website was interested in consumer spending during the holiday shopping weekend after Thanksgiving. They collect data on a random sample of 400 shoppers, particularly noting how much money each shopper spent. The following histogram was constructed using the data: 50 100 200 250 300 150 Spending The retailer determines that this sample had an average of $84.71 with a standard deviation of $46.87. a. (1 point) What is...
 D Question 25 4 pts The average age of online consumers a few years ago was 23.3 years. As older individuals gain confidence and trust in theinternet, it is believed that the average age has increased. To test this belief, we selected a random sample of 40 individuals who have made an online purchase this year. The online shoppers in our sample had an average age of 25.2 years, with a standard deviation of 5.3 years. The P-value associated with...
 show work please
Problem 2: Use the following to answer questions a)-e): A random sample of 48 students at a large university reported getting an average of 7 hours of sleep on weeknights, with standard deviation 1.62 hours. A dotplot of the data is provided. 9.6 Weekniaht Sleep a. Briefly explain why it is reasonable to use a t-distribution to perform inference about the mean amount of weeknight sleep for students at this university. (2 points) The research question: It...
show work please
Problem 2: Use the following to answer questions a)-e): A random sample of 48 students at a large university reported getting an average of 7 hours of sleep on weeknights, with standard deviation 1.62 hours. A dotplot of the data is provided. 9.6 Weekniaht Sleep a. Briefly explain why it is reasonable to use a t-distribution to perform inference about the mean amount of weeknight sleep for students at this university. (2 points) The research question: It...
 e Section 3: 2 Scores/Percentiles and Hypothesis Testing Please show work. You wil need to refer to Z score tables for this rtin 6. The national (population) average for ACT scores is 208 (on a 36 point a. Suppose you score 26 on does this score fall? (Find your ACT. At approximately what percentile (round to the nearest integer between 1 and 99) your probability from the Z table, subtract that from 1, multiply by 100, and round) Answer that...
Most questions answered within 3 hours.
-
284 mL of a 0.52 M potassium hydroxide solution is added to 467
mL of a...
asked 21 minutes ago -
exercise on VSEPR and molecular structrue.
octahedral
SeCl62-
TeCl62-
ClF62-
distorted
SeF62–
IF6–
asked 22 minutes ago -
Little’s Law: Val d’Costa is a world famous ski village in the
French Alps. Because of...
asked 1 hour ago -
Find the absolute error D for the calculation if A + B/C=D A=
9.4 +/- 0.4...
asked 1 hour ago -
New Air Heating and Cooling, manufactures furnaces and central
air units. The company pride itself on...
asked 1 hour ago -
A coach uses a new technique to train gymnasts. Seven
gymnasts were randomly selected and their...
asked 3 hours ago -
While rotating the tires on your car you notice a rock [mass =
0.1 Kg] stuck...
asked 5 hours ago -
Using MARS simulator, write MIPS programs according to
the following scenarios: Receive a positive integer number...
asked 7 hours ago -
An object in front of a concave mirror has a real image that is
11.5 cm...
asked 7 hours ago -
Consider the reaction, C3 H8 + O2 --> CO2 + H2O. How many
moles of O2...
asked 9 hours ago -
You and your opponent both roll a fair die. If you both roll the
same number,...
asked 9 hours ago -
In a study of the accuracy of fast food drive-through orders,
Restaurant A had 257 accurate...
asked 9 hours ago