Hello, appreciate if anyone could help me on Multiple Regression analysis. Thanks!


Coefficients Callinearity Statistics Correlations Sig. Unstandardized Coefficients Std Error 180 Standardized Model Coefficients Partial VIF Tolerance Zero- Part Beta order .000 376 (Constant Age Gender 19.580 3.524 1.032 .969 050 050 056 .887 060 050 047 053 1.032 .969 056 -1.002 317 -.066 -.057 -.072 072 286 2.620 009 749 (Constant) Age Gender 2 Perceived Usefulness 955 1.047 1.051 159 079 067 1.413 060 .045 068 064 951 772 015 323 747 -066 018 .016 020 061 1.295 248 214 000 4.552 428 046 .244 210 .761 1.314 248 214 424 246 4.553 000 051 231 Complementary Convenience (Constant) Age Gender 1.251 799 233 200 000 650 407 224 4.258 049 207 -455 259 -.118 1.051 044 952 043 275 062 1.093 732 060 .045 039 1.055 948 041 029 465 -.066 030 .052 .038 1.392 718 428 .136 097 2.418 016 Perceived 3 Usefulness .115 099 041 687 1.456 .110 079 Complementary 051 004 424 1.959 046 .095 090 1.338 747 161 116 407 3 Convenience Entertainment a. Dependent Variable: Pleasure of Browsing 124 1.418 188 189 705 4.698 513 257 225 000 040
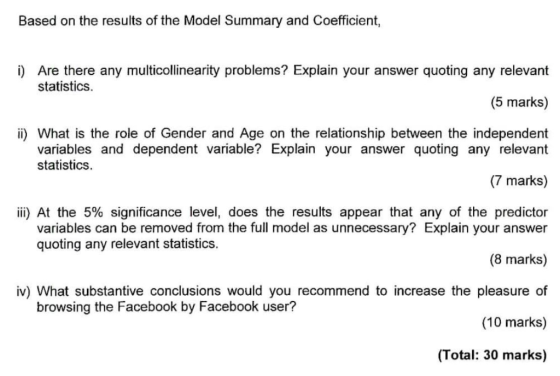
Based on the results of the Model Summary and Coefficient, i) Are there any multicollinearity problems? Explain your answer statistics quoting any relevant (5 marks) ii) What is the role of Gender and Age variables and dependent variable? Explain your answer statistics on the relationship between the independent quoting any relevant (7 marks) ili)At the 5% significance level, does the results appear that any of the predictor variables can be removed from the full model as unnecessary? Explain your answer quoting any relevant statistics. (8 marks) iv) What substantive conclusions would you recommend to increase the pleasure of browsing the Facebook by Facebook user? (10 marks) (Total: 30 marks)
Homework Answers
i)
Multicollinearity of the predictor variables are defined by Variance Inflation Factors(VIF) statistic. If the measures VIF statistic value is between 1 to 10, then there is no sign of multicollinearity.
From the regression model summary,
| Model | Predictor variable | VIF | Multicollinearity |
| 1 | Age | 1.032 | no |
| Gender | 1.032 | no | |
| 2 | Age | 1.047 | no |
| Gender | 1.051 | no | |
| Perceived Usefulness | 1.295 | no | |
| Complementary | 1.314 | no | |
| Convenience | 1.251 | no | |
| 3 | Age | 1.051 | no |
| Gender | 1.055 | no | |
| Perceived Usefulness | 1.392 | no | |
| Complementary | 1.456 | no | |
| Convenience | 1.338 | no | |
| Entertainment | 1.418 | no |
ii)
The significance of predictor variables, age and gender determine by significance p-value of the respective coefficient value.
From the regression model summary,
| Model | Predictor variable | Coefficient | Sig. | ||
| 1 | Age | 0.047 | 0.376 | >0.05 | Not Significant |
| Gender | -0.071 | 0.317 | >0.05 | Not Significant | |
| 2 | Age | 0.064 | 0.159 | >0.05 | Not Significant |
| Gender | 0.02 | 0.747 | >0.05 | Not Significant | |
| 3 | Age | 0.043 | 0.275 | >0.05 | Not Significant |
| Gender | 0.038 | 0.465 | >0.05 | Not Significant |
In each of the three model both the predictor variable Age and Gender are not significant at 5% significance level.
iii)
| Model | Predictor variable | Significance P-value | |
| 1 | Age | 0.376 | Not Significant |
| Gender | 0.317 | Not Significant | |
| 2 | Age | 0.159 | Not Significant |
| Gender | 0.747 | Not Significant | |
| Perceived Usefulness | 0 | Significant | |
| Complementary | 0 | Significant | |
| Convenience | 0 | Significant | |
| 3 | Age | 0.275 | Not Significant |
| Gender | 0.465 | Not Significant | |
| Perceived Usefulness | 0.016 | Significant | |
| Complementary | 0.051 | Significant | |
| Convenience | 0.004 | Significant | |
| Entertainment | 0 | Significant |
All the other predictor variable except Age and Gender are significant hence only these two variable need to be removed from the model.
iv)
The R-square value and adjusted R-square value both increased by adding the predictor variables Perceived Usefulness, Complementary and Convenience in model 2 and further increase by adding Entertainment in model 3. These variables significantly explains the model while the variables Age and Gender need to be remove to improve the model further.
Add Answer to:
Hello, appreciate if anyone could help me on Multiple Regression
analysis. Thanks!
Question 4 Use the...
Most questions answered within 3 hours.
-
A galaxy is a large grouping of stars. Approximately how many
stars are in the Milky...
asked 10 minutes ago -
The Pen, Evan, and Torves Partnership has asked you to assist in
winding-up its business affairs....
asked 13 minutes ago -
A) Asha Company completed its inventory count. It arrived at a
total inventory value of
$200,000....
asked 1 hour ago -
When you move a rope up and down, waves are created. If the
waves pass through...
asked 1 hour ago -
QUESTION 52
Which of the following is a direct result of scarcity?
A college student misses...
asked 1 hour ago -
The zero order reaction 2N2O→2N2+O2 has the rate constant k of
7.20×10⁻³ molL s. If the...
asked 1 hour ago -
When you borrow money to buy a house, a car, or for some other
purpose, you...
asked 1 hour ago -
Write a c program that finds the uncommon elements from two
array elements using pointers
only...
asked 1 hour ago -
SQL help:
Design a database diagram for a database that stores information
about the Downloads that...
asked 3 hours ago -
In 1970s and 1980s, molecular biologists discovered that the
hormone testosterone, binds a receptor protein that...
asked 5 hours ago -
january 1 2010 road catering service purchase a piece of
equipment for 58000 which is expected...
asked 5 hours ago -
Explain Mertons concept of anomie is and what the
modes of adaptation to it are?
asked 6 hours ago