
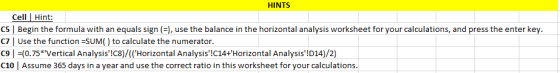


HINTS Cell Hint: C5 | Begin the formula with an C7 Use the function SUM) to calculate the numerator. c9 (0.75*Vertical Analysis'!C8)/(('Horizontal Analysis'!c14+Horizontal Analysis'!D14)/2) C10 | Assume 365 days in a year and use the correct ratio in this worksheet for your calculations. use the balance in the horizontal analysis worksheet for your calculations, and press the enter key. equals sign (),
June 30 2018 and 2019 5 6 Increase (Decrease) Amount 7 Percentage 2019 2018 8 Assets 9 10 Current Assets $ 125,000,00 $ 685,000.00 $ $ 5.04% 5.38% Cash 119.000.00 6.000.00 11 $ 650.000.00 Short Term Investments 35,000.00 12 27,000.00 $ (5,000.00) Accounts Receivable 225,000.00 198.000.00 13.64% 13 Merchandise Inventory S S -7.14% 65.000.00 70,000.00 14 4,000.00 S 67.000.00 S 43.000.00 Other Current Assets 195,000.00 191,000.00 S 2.09% 15 16 Total Current Assets 17 PPE 18 Total Assets $1,295,000.00 $ 875,000.00 $2,170,000.00 $2,060,000.00 $1,228,000.00 $ 832.000,00 5.46% 5.17% $110,000.00 5.34% 19 Liabilities 20 21 Current Liabiltiies: Accounts payable Accrued Liabilities 265,000.00 251,750.00 641,000.00 $ 725.523.00 906,000.00 977,273.00 S 13,250.00 (84,523.00) S (71,273.00) 5.26% 22 -11.65% 23 24 Total Current Liabilities -7.29% 25 Long-Term Liabilities Bonds Payable Mortgage payable 28 Total Long Term Liabilities 29 Total Liabilities $ 100,000.00 $ (25,000.00) $ 75,000.00 3,727.00 250,000.00 150,000.00 $150,000.00 175,000.00 400,000.00 325,000.00 $1,306,000.00 $1,302,273.00 66.67% 26 -14.29% 27 23.08% S 0.29% Stockholders' Equity 30 225,000.00 $ 225,000.00 31 Common Stock S 0.00% 32 Paid in Capital 33 Reatined Earnings 34 Total Stockholders' Equity 35 Total Liabilities & Stockholders' Equity S 58,000.00 581,000.00 58.000.00 S 0.00% $ 474,727.00 22.39% $106,273.00 $106,273.00 $110,000.00 S 864,000.00 $2,170,000.00 $2,060,000.00 $ 757,727.00 14.03% 5.34% 36
Riverside Sweets Income statement Year ended June 30,2019 A P $28,00,000 Net Sales 100% Cost of goods sold 1551600 55% Gross Profit 1248400 45% Operating expenses 450540 16% 797860 28% Operating Income Other Income and (Expenses) Interest expenses 15000 1% 782860 Income Before Income taxes 28% Income Tax expenses 153529 5% $6,29,331 Net Income 22%
Homework Answers
1.Working Capital = Current Assets - Current Liabilities
2019 = 1295000 - 906000 = 389000 ; 2018 = 1228000 - 977273 = 250727
2.Current Assets = Current Assets / Current Liabilities
2019 = 1295000 / 906000 = 1.43 ; 2018 = 1228000 / 977273 = 1.26
3.Acid Test Ratio = Quick Assets / Current Liabilities
2019 = ( 125000 + 685000 + 225000 ) / 906000 = 1.14 ; 2018 = ( 119000 + 650000 + 198000 ) / 977273 = 0.989
4.Cash Ratio = Cash / Current Liabilities
2019 = 125000 / 906000 = 0.138 ; 2018 = 119000 / 977273 = 122
5.Accounts Receivable Turnover = Sales / Avg.Receivables
2019 = 2800000 / ( 225000 + 198000 ) / 2 = 2800000 / 211500 = 13.24
6.Days Sales in Receivables = 365 / Accounts Receivable Turnover = 365 / 13.24 = 27.57 Days
7.Inventory Turnover = Cost of goods sold / Avg.Inventory = 1551600 / ( 65000 + 70000 ) / 2 = 1551600 / 67500 = 22.99
8.Days Sales in Inventory = 365 / Inventory Turnover = 365 / 22.99 = 15.88 Days
9.Gross Profit Percentage = Gross Profit / Sales = 1248400 / 2800000 = 44.59%
10.Debt Ratio = Total Liabilities / Total Assets
2019 = 1306000 / 2170000 = 0.60 ; 2018 = 1302273 / 2060000 = 0.63
11.Debt to Equity Ratio = Total Liabilities / Total Equity
2019 = 1306000 / 864000 = 1.51 ; 2018 = 1302273 / 757727 = 1.72
12.Times Interest Earned Ratio = Operating Income / Interest Expense
2019 = 797860 / 15000 = 53.19
13.Profit Margin Ratio = Net Income / Sales = 629331 / 2800000 = 22.48%
14.Rate of Return on Total Assets = Net Income /Total Assets = 629331 / 2170000 = 29%
15.Asset Turnover Ratio = Sales / Avg. Total Assets = 2800000 / ( 2170000 + 2060000 ) / 2 = 2800000 / 2115000 = 1.32
16.Rate of Return on Common Stockholders Equity = Net Income / Avg. Common Stockholders Equity
629331 / ( 864000 + 757727 ) / 2 = 629331 / 810864 = 0.776
17.Earning per share = Net Income / Outstanding no. of shares = 629331 / 225000/10 = 27.97
18.Price Earnings Ratio = Market Price / EPS ...Market price not provided
Dividend not provided
Add Answer to:
Compute the following ratios. Do not round your calculations. (Always use cell references and formulas where...
(use 365 days a year. Round your intermediate calculations and final answers to 1 decimal place.)...
 (use 365 days a year. Round your intermediate calculations and
final answers to 1 decimal place.)
Problem 12-4A Calculate risk ratios (L012-3) The following income statement and balance sheets for Virtual Gaming Systems are provided. VIRTUAL GAMING SYSTEMS Income Statement For the year ended December 31, 2018 Net sales Cost of goods sold $3,066,000 1,956,000 1.110,000 Gross profit Expenses Operating expenses Depreciation expense Loss on sale of land Interest expense Income tax expense $864.000 30,000 8,600 18,000 54,000 Total expenses...
(use 365 days a year. Round your intermediate calculations and
final answers to 1 decimal place.)
Problem 12-4A Calculate risk ratios (L012-3) The following income statement and balance sheets for Virtual Gaming Systems are provided. VIRTUAL GAMING SYSTEMS Income Statement For the year ended December 31, 2018 Net sales Cost of goods sold $3,066,000 1,956,000 1.110,000 Gross profit Expenses Operating expenses Depreciation expense Loss on sale of land Interest expense Income tax expense $864.000 30,000 8,600 18,000 54,000 Total expenses...
Required: a. Using the financial statements, compute the following ratios for Flowers Co. for 2019. Show...
 Required:
a. Using the financial statements, compute the following ratios
for Flowers Co. for 2019. Show all computations.
(4
marks)
1. Current
ratio.
2. Acid-test ratio.
3. Accounts receivable
turnover.
4. Inventory turnover.
5. Profit
margin.
6. Return on assets.
7. Assets
turnover.
8. Times interest earned.
9. Working capital.
10. Debt to assets ratio.
The financial statements of Flowers Co. appear below: Flowers Co. Comparative Balance Sheets December 31, 2018 - 2019 Assets Caela Short-term investments Accounts receivable...
Required:
a. Using the financial statements, compute the following ratios
for Flowers Co. for 2019. Show all computations.
(4
marks)
1. Current
ratio.
2. Acid-test ratio.
3. Accounts receivable
turnover.
4. Inventory turnover.
5. Profit
margin.
6. Return on assets.
7. Assets
turnover.
8. Times interest earned.
9. Working capital.
10. Debt to assets ratio.
The financial statements of Flowers Co. appear below: Flowers Co. Comparative Balance Sheets December 31, 2018 - 2019 Assets Caela Short-term investments Accounts receivable...
EXERCISE - CHAPTER 19. RATIOS: From the following Information, compute the ratios indicated and place the...
 EXERCISE - CHAPTER 19. RATIOS: From the following Information, compute the ratios indicated and place the proper number in the blanks provided. ASSETS: Cash $10,000 Marketable Securities $15,000 Accounts Receivable, Net $20,000 Inventory $30,000 Prepaid Assets $ 5,000 Property, Plant & Equipment $100,000 Total Assets: $180,000 LIABILITIES & STOCKHOLDERS' EQUITY: Current Liabilities $20,000 Long-Term Liabilities $80,000 Stockholders' Equity $80,000 Total Liabilities & Stockholder's Equity: $180,000 Sales $200,000 Cost of Goods Sold $150.000 Gross Margin $ 50,000 Operating Expense $ 30,000...
The Hershey Company Analysis Using the financial statements of the Hershey Company compute the following ratios...
 The Hershey Company Analysis Using the financial statements of the Hershey Company compute the following ratios (hint: when computing the return on equity use the amount for Total Stockholders' Equity when computing the average) for 2019: 1. Inventory turnover ratio 2. Average days in inventory 3. Receivables turnover ratio 4. Average collection period 5. Asset turnover ratio 6. Profit margin on sales 7. Return on assets 8. Return on equity THE HERSHEY COMPANY CONSOLIDATED STATEMENTS OF INCOME in thousands, except...
Compute the following ratios: (Use a 360-day year. Do not round intermediate calculations. Round your answers...
 Compute the following ratios: (Use a 360-day year. Do
not round intermediate calculations. Round your answers to 2
decimal places. Input your debt-to-total assets answer as a percent
rounded to 2 decimal places.)
The balance sheet for Stud Clothiers is shown next. Sales for the year were $3,190,000, with 75 perc STUD CLOTHIERS Balance Sheet 20X1 Liabilities and Equity %24 Assets Accounts payable Cash 279,000 24,000 Accounts receivable Inventory Plant and equipment 283,000 266,000 450,000 Accrued taxes 107,000 130,000 Bonds...
Compute the following ratios: (Use a 360-day year. Do
not round intermediate calculations. Round your answers to 2
decimal places. Input your debt-to-total assets answer as a percent
rounded to 2 decimal places.)
The balance sheet for Stud Clothiers is shown next. Sales for the year were $3,190,000, with 75 perc STUD CLOTHIERS Balance Sheet 20X1 Liabilities and Equity %24 Assets Accounts payable Cash 279,000 24,000 Accounts receivable Inventory Plant and equipment 283,000 266,000 450,000 Accrued taxes 107,000 130,000 Bonds...
Q-2 FINANCIAL RATIO FORMULAS Match each of the following financial ratios with its formula: Accounts Payable...
 Q-2 FINANCIAL RATIO FORMULAS Match each of the following financial ratios with its formula: Accounts Payable Tunover Ratio Fixed Asset Turnover Ratio Asset Turnover Ratio Cash Coverage Ratio Cash Ratio Current Ratio Average Age of Receivables Average Days Supply in Inventory Receivable Turnover Ratio Debt-to-Equity Ratio Earnings per Share (EPS) Financial Leverage Percentage Times Interest Earned Ratio Inventory Turnover Ratico Price/ Earnings (P/E) Ratio Profit Margin Quality of Income Quick Ratio Return on Equity (ROE) Return on Assets (ROA) A....
Problem 12-6A Use ratios to analyze risk and profitability (LO12-3, 12-4) (The following information applies to...
 Problem 12-6A Use ratios to analyze risk and profitability (LO12-3, 12-4) (The following information applies to the questions displayed below.] Income statements and balance sheets data for Virtual Gaming Systems are provided below. VIRTUAL GAMING SYSTEMS Income Statements For the year ended December 31 2019 Net sales $3.545,000 Cost of goods sold 2.487000 2018 $3,071,000 1957.000 1,058.000 1,114,000 Gross profit Expenses Operating expenses Depreciation expense Loss on sale of land Interest expense Income tax expense 962,000 37,000 865,000 30.500 8.700...
Shown below, is a Comparative Balance sheet using Horizontal analysis, please prepare an Income statement using...
Shown below, is a Comparative Balance sheet using Horizontal analysis, please prepare an Income statement using vertical Analysis Robust Robots, Inc. Comparative Balance Sheet- Horizontal Analysis December 31, 2019 and 2018 Assets 2019 2018 Differents Percentage Current Assets: Cash $65,000 $80,000 $ (15,000.00) -18.75% Accounts Receivable, net $150,000 $100,000 $ 50,000.00 50.00% Merchandise Inventory $135,000 $70,000 $ 65,000.00 92.86% Supplies $9,700 $500 $ 9,200.00 1840.00% Prepaid Insurance $30,000 $10,000 $ 20,000.00 200.00% Total Current Assets $389,700 $260,500 $ 129,200.00 49.60%...
QUESTION 3 From following financial statements, calculate following ratios and analyse the current year and previous...
 QUESTION 3 From following financial statements, calculate following ratios and analyse the current year and previous year performance a) Current ratio. b) Days sales outstanding (DSO). (Sales 2017 RM500m & Sales 2018 RM600m) c) Inventory turnover ratio d) Total debt to assets e) Return on assets (ROA) (Net income 2017 RM42m &Net income 2018 RM58m) Moon Inc. Balance Sheet (RM millions) as at December 31, 2015 and 2016 2015 21 51 2016 20 84 Cash Accounts receivable Inventory Prepaid expenses...
1. Given the 2019 ratios of Verizon wireless what do EACH of these ratios indicate about...
1. Given the 2019 ratios of Verizon wireless what do EACH of these ratios indicate about the company specifically? (not just as a whole) 2. Lastly, at the end, in one paragraph what do these calculations (all together) mean for the companies financial health? Answers must be broken down into everyday language and not in "financial talk" Profit ratios: gross profit margin (gross profit / sales)*100 gross profit 77142000 sales 131868000 gross profit margin 58.50% operating profit margin (operating profit...
 (use 365 days a year. Round your intermediate calculations and
final answers to 1 decimal place.)
Problem 12-4A Calculate risk ratios (L012-3) The following income statement and balance sheets for Virtual Gaming Systems are provided. VIRTUAL GAMING SYSTEMS Income Statement For the year ended December 31, 2018 Net sales Cost of goods sold $3,066,000 1,956,000 1.110,000 Gross profit Expenses Operating expenses Depreciation expense Loss on sale of land Interest expense Income tax expense $864.000 30,000 8,600 18,000 54,000 Total expenses...
(use 365 days a year. Round your intermediate calculations and
final answers to 1 decimal place.)
Problem 12-4A Calculate risk ratios (L012-3) The following income statement and balance sheets for Virtual Gaming Systems are provided. VIRTUAL GAMING SYSTEMS Income Statement For the year ended December 31, 2018 Net sales Cost of goods sold $3,066,000 1,956,000 1.110,000 Gross profit Expenses Operating expenses Depreciation expense Loss on sale of land Interest expense Income tax expense $864.000 30,000 8,600 18,000 54,000 Total expenses...
 Required:
a. Using the financial statements, compute the following ratios
for Flowers Co. for 2019. Show all computations.
(4
marks)
1. Current
ratio.
2. Acid-test ratio.
3. Accounts receivable
turnover.
4. Inventory turnover.
5. Profit
margin.
6. Return on assets.
7. Assets
turnover.
8. Times interest earned.
9. Working capital.
10. Debt to assets ratio.
The financial statements of Flowers Co. appear below: Flowers Co. Comparative Balance Sheets December 31, 2018 - 2019 Assets Caela Short-term investments Accounts receivable...
Required:
a. Using the financial statements, compute the following ratios
for Flowers Co. for 2019. Show all computations.
(4
marks)
1. Current
ratio.
2. Acid-test ratio.
3. Accounts receivable
turnover.
4. Inventory turnover.
5. Profit
margin.
6. Return on assets.
7. Assets
turnover.
8. Times interest earned.
9. Working capital.
10. Debt to assets ratio.
The financial statements of Flowers Co. appear below: Flowers Co. Comparative Balance Sheets December 31, 2018 - 2019 Assets Caela Short-term investments Accounts receivable...
 EXERCISE - CHAPTER 19. RATIOS: From the following Information, compute the ratios indicated and place the proper number in the blanks provided. ASSETS: Cash $10,000 Marketable Securities $15,000 Accounts Receivable, Net $20,000 Inventory $30,000 Prepaid Assets $ 5,000 Property, Plant & Equipment $100,000 Total Assets: $180,000 LIABILITIES & STOCKHOLDERS' EQUITY: Current Liabilities $20,000 Long-Term Liabilities $80,000 Stockholders' Equity $80,000 Total Liabilities & Stockholder's Equity: $180,000 Sales $200,000 Cost of Goods Sold $150.000 Gross Margin $ 50,000 Operating Expense $ 30,000...
 The Hershey Company Analysis Using the financial statements of the Hershey Company compute the following ratios (hint: when computing the return on equity use the amount for Total Stockholders' Equity when computing the average) for 2019: 1. Inventory turnover ratio 2. Average days in inventory 3. Receivables turnover ratio 4. Average collection period 5. Asset turnover ratio 6. Profit margin on sales 7. Return on assets 8. Return on equity THE HERSHEY COMPANY CONSOLIDATED STATEMENTS OF INCOME in thousands, except...
 Compute the following ratios: (Use a 360-day year. Do
not round intermediate calculations. Round your answers to 2
decimal places. Input your debt-to-total assets answer as a percent
rounded to 2 decimal places.)
The balance sheet for Stud Clothiers is shown next. Sales for the year were $3,190,000, with 75 perc STUD CLOTHIERS Balance Sheet 20X1 Liabilities and Equity %24 Assets Accounts payable Cash 279,000 24,000 Accounts receivable Inventory Plant and equipment 283,000 266,000 450,000 Accrued taxes 107,000 130,000 Bonds...
Compute the following ratios: (Use a 360-day year. Do
not round intermediate calculations. Round your answers to 2
decimal places. Input your debt-to-total assets answer as a percent
rounded to 2 decimal places.)
The balance sheet for Stud Clothiers is shown next. Sales for the year were $3,190,000, with 75 perc STUD CLOTHIERS Balance Sheet 20X1 Liabilities and Equity %24 Assets Accounts payable Cash 279,000 24,000 Accounts receivable Inventory Plant and equipment 283,000 266,000 450,000 Accrued taxes 107,000 130,000 Bonds...
 Q-2 FINANCIAL RATIO FORMULAS Match each of the following financial ratios with its formula: Accounts Payable Tunover Ratio Fixed Asset Turnover Ratio Asset Turnover Ratio Cash Coverage Ratio Cash Ratio Current Ratio Average Age of Receivables Average Days Supply in Inventory Receivable Turnover Ratio Debt-to-Equity Ratio Earnings per Share (EPS) Financial Leverage Percentage Times Interest Earned Ratio Inventory Turnover Ratico Price/ Earnings (P/E) Ratio Profit Margin Quality of Income Quick Ratio Return on Equity (ROE) Return on Assets (ROA) A....
 Problem 12-6A Use ratios to analyze risk and profitability (LO12-3, 12-4) (The following information applies to the questions displayed below.] Income statements and balance sheets data for Virtual Gaming Systems are provided below. VIRTUAL GAMING SYSTEMS Income Statements For the year ended December 31 2019 Net sales $3.545,000 Cost of goods sold 2.487000 2018 $3,071,000 1957.000 1,058.000 1,114,000 Gross profit Expenses Operating expenses Depreciation expense Loss on sale of land Interest expense Income tax expense 962,000 37,000 865,000 30.500 8.700...
 QUESTION 3 From following financial statements, calculate following ratios and analyse the current year and previous year performance a) Current ratio. b) Days sales outstanding (DSO). (Sales 2017 RM500m & Sales 2018 RM600m) c) Inventory turnover ratio d) Total debt to assets e) Return on assets (ROA) (Net income 2017 RM42m &Net income 2018 RM58m) Moon Inc. Balance Sheet (RM millions) as at December 31, 2015 and 2016 2015 21 51 2016 20 84 Cash Accounts receivable Inventory Prepaid expenses...
Most questions answered within 3 hours.
-
PLEASE HELP, NO ONE IS ANSWERING MY QUESTION AND IT IS SUE TODAY
WORTH 20% OF...
asked 11 minutes ago -
α = 0.0007889 T, I = 2.9 A
Other Magnetic Fields: First, based on your
value...
asked 10 minutes ago -
This assignment is a continuation of the 2nd one. You as a HR
Manager, select an...
asked 12 minutes ago -
Hastings Entertainment has a beta of 0.64. If the market return
is expected to be 13.80...
asked 24 minutes ago -
9. Depository institutions are always:
a. illiquid
b. profitable
c. insolvent
d. all of the above...
asked 32 minutes ago -
Use AstroTurf Company's income statement below to answer the
following two questions. Answer these questions with...
asked 32 minutes ago -
How is a firm's task
environment different from its general environment? Provide
examples of both types...
asked 30 minutes ago -
What is one reason Innovators can adopt innovations so
early?
Group of answer choices
they are...
asked 32 minutes ago -
Show that min x^2, s.t. x>=2 has strong duality.
asked 33 minutes ago -
Using curved arrows show how the intermediate formed in this
reaction (Hexaphenylbenzene is prepared through a...
asked 38 minutes ago -
Two lightbulbs operate on the same current. Bulb A has four
times the power output of...
asked 35 minutes ago -
1. What five (5) basic parameters need to be measured
during a pump test in order...
asked 46 minutes ago