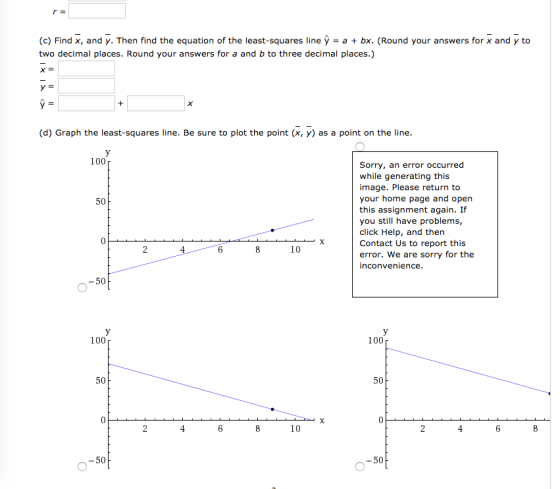

r = a bx. (Round your answers for x and y to (c) Find x, and y. Then find the equation of the least-squares line y = two decimal places. Round your answers for a and b to three decimal places.) х3 y + X point on the line (d) Graph the least-squares line. Be sure to plot the point (x, y) as a 100 Sorry, an error occurred while generating this image. Please return to your home page and open this assignment again. If you still have problems, 50 click Help, and then Contact Us to report this X 2 4. 6 10 error. We are sorry for the inconvenience 50 100 100 50 50 X 2 4. 6 8 10 -50 -50 -
(e) Find the value of the coefficient of determination 2. What percentage of the variation in y can be explained by the corresponding variation in x and the least-squares line? What percentage is unexplained? (Round your answer for r2 to three decimal places. Round your answers for the percentages to one decimal place.) explained % unexplained (f) Suppose a small city in Oregon has a per capita income of 9.2 thousand dollars. What is the predicted number of M.D.s per 10,000 residents? (Round your answer to two decimal places.) M.D.s per 10,000 residents
Homework Answers

b)


r= 0.796
c)
xbar =8.8
ybar =14.02
yhat= -41.079+6.261x
d)
top left curve is correct
e)
r2 =0.634
explained =63.4%
unexplained =36.6%
f)predicted number = -41.079+6.261*9.2 =16.52
Add Answer to:
Let x be per capita income in thousands of dollars. Let y be the number of...
Let x be per capita income in thousands of dollars. Let y be the number of medical doctors per 10,000 residents. Six small cities in Oregon gave the following information about x and y. x 8.2 9.7 10.0...
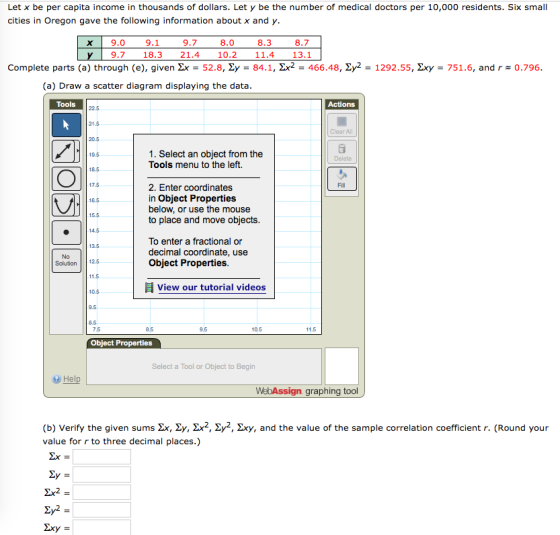
Let x be per capita income in thousands of dollars. Let y be the number of medical doctors per 10,000 residents. Six small cities in Oregon gave the following information about x and y. x 8.2 9.7 10.0 8.0 8.3 8.7 y 9.5 18.7 20.2 10.2 11.4 13.1 Complete parts (a) through (e), given Σx = 52.9, Σy = 83.1, Σx2 = 469.91, Σy2 = 1253.59, Σxy = 751.48, and r ≈ 0.991. (a) Draw a scatter diagram displaying the...
15. -1.16 points BBUnderStat12 9.2.013. /100 Submissions Used My Notes Ask Your Let x be per capi...
 15. -1.16 points BBUnderStat12 9.2.013. /100 Submissions Used My Notes Ask Your Let x be per capita income in thousands of dollars. Let y be the number of medical doctors per 10,000 residents. Six small cities in Oregon gave the following information about x and y Complete parts (a) through (e), given Σχ " 532, Σ,. 842 Σκ2 474 B, Zy2-1297 98Lxy 76404, and r #0921. (a) Draw a scatter diagram displaying the data Flash Player version 10 or higher...
t An economist is studying the job market in Denver area neighborhoods. Let x entry-level jobs...
 t An economist is studying the job market in Denver area neighborhoods. Let x entry-level jobs in the same nelghborhood. A sample of six Deniver neghborhoods gave the folowing iformacion (ents in hundreds of yobs) represent the total number of jobs in a given neighborhood, and let y represent the number Complete parts (a) therough te), given x-201, y-27,-7759,-161, By-1082, and r0.882 () Draw a scer dagram dsplaying the data 1. Select an n Object Properties to place and move...
Do heavier cars really use more gasoline? Suppose a car is chosen at random. Let x be the weight of the car (in hundreds of pounds), and let y be the miles per gallon (mpg). x 29 44 33 47 23 40 34 52...
Do heavier cars really use more gasoline? Suppose a car is chosen at random. Let x be the weight of the car (in hundreds of pounds), and let y be the miles per gallon (mpg). x 29 44 33 47 23 40 34 52 y 32 20 26 13 29 17 21 14 Complete parts (a) through (e), given Σx = 302, Σy = 172, Σx2 = 12,064, Σy2 = 4036, Σxy = 6066, and r ≈ −0.902. (a) Draw...
Let x be the age of a licensed driver in years. Let y be the percentage...
Let x be the age of a licensed driver in years. Let y be the percentage of all fatal accidents (for a given age) due to failure to yield the right of way. For example, the first data pair states that 5% of all fatal accidents of 37-year-olds are due to failure to yield the right of way. x 37 47 57 67 77 87 y 5 8 10 17 33 42 Complete parts (a) through (e), given Σx =...
an economist is studying the job market in Denver area neighborhoods. Let x represent the total...
 an economist is studying the job market in Denver area neighborhoods. Let x represent the total number of jobs in a given neighborhood, and let y represent the number of entry-level jobs in the same neighborhood. A sample of six Denver neighborhoods gave the following information (units in hundreds of jobs). x 17 3051 2850 25 Complete parts (a) through (e), given Ex - 201, 2y = 26, 2x - 7699, y - 150. Lxy - 1027, and re 0.822....
Do heavier cars really use more gasoline? Suppose a car is chosen at random. Let x...
Do heavier cars really use more gasoline? Suppose a car is chosen at random. Let x be the weight of the car (in hundreds of pounds), and let y be the miles per gallon (mpg). x 30 43 31 47 23 40 34 52 y 30 21 22 13 29 17 21 14 Complete parts (a) through (e), given Σx = 300, Σy = 167, Σx2 = 11,908, Σy2 = 3761, Σxy = 5885, and r ≈ −0.888. (a) Draw...
It is thought that prehistoric Indians did not take their best tools, pottery, and household items...
 It is thought that prehistoric Indians did not take their best tools, pottery, and household items when they visited higher elevations for their summer camps. It is hypothesized that archaeological sites tend to lose their cultural identity and specific cultural affiliation as the elevation of the site increases. Let x be the elevation (in thousands of feet) of an archaeological site in the southwestern United States. Let y be the percentage of unidentified artifacts (no specific cultural affiliation) at a...
You are the foreman of the Bar-S cattle ranch in Colorado. A neighboring ranch has calves...
 You are the foreman of the Bar-S cattle ranch in Colorado. A neighboring ranch has calves for sale, and you are going to buy some calves to add to the Bar-S herd. How much should a healthy calf weigh? Let x be the age of the calf (in weeks), and let y be the weight of the calf (in kilograms). x 3 3 8 16 26 36 y 44 52 75 100 150 200 Complete parts (a) through (e), given...
An economist is studying the job market in Denver area neighborhoods. Let x represent the total...
 An economist is studying the job market in Denver area neighborhoods. Let x represent the total number of jobs in a given neighborhood, and let y represent the number of entry-level jobs in the same neighborhood. A sample of six Denver neighborhoods gave the following information (units in hundreds of jobs). X 17 35 53 28 SO 25 2 36 593 Complete parts (a) through (e), given Ex = 208, Ly - 28, 2x - 3232, LV-164, Exy = 1122,...
 15. -1.16 points BBUnderStat12 9.2.013. /100 Submissions Used My Notes Ask Your Let x be per capita income in thousands of dollars. Let y be the number of medical doctors per 10,000 residents. Six small cities in Oregon gave the following information about x and y Complete parts (a) through (e), given Σχ " 532, Σ,. 842 Σκ2 474 B, Zy2-1297 98Lxy 76404, and r #0921. (a) Draw a scatter diagram displaying the data Flash Player version 10 or higher...
 t An economist is studying the job market in Denver area neighborhoods. Let x entry-level jobs in the same nelghborhood. A sample of six Deniver neghborhoods gave the folowing iformacion (ents in hundreds of yobs) represent the total number of jobs in a given neighborhood, and let y represent the number Complete parts (a) therough te), given x-201, y-27,-7759,-161, By-1082, and r0.882 () Draw a scer dagram dsplaying the data 1. Select an n Object Properties to place and move...
 an economist is studying the job market in Denver area neighborhoods. Let x represent the total number of jobs in a given neighborhood, and let y represent the number of entry-level jobs in the same neighborhood. A sample of six Denver neighborhoods gave the following information (units in hundreds of jobs). x 17 3051 2850 25 Complete parts (a) through (e), given Ex - 201, 2y = 26, 2x - 7699, y - 150. Lxy - 1027, and re 0.822....
 It is thought that prehistoric Indians did not take their best tools, pottery, and household items when they visited higher elevations for their summer camps. It is hypothesized that archaeological sites tend to lose their cultural identity and specific cultural affiliation as the elevation of the site increases. Let x be the elevation (in thousands of feet) of an archaeological site in the southwestern United States. Let y be the percentage of unidentified artifacts (no specific cultural affiliation) at a...
 You are the foreman of the Bar-S cattle ranch in Colorado. A neighboring ranch has calves for sale, and you are going to buy some calves to add to the Bar-S herd. How much should a healthy calf weigh? Let x be the age of the calf (in weeks), and let y be the weight of the calf (in kilograms). x 3 3 8 16 26 36 y 44 52 75 100 150 200 Complete parts (a) through (e), given...
 An economist is studying the job market in Denver area neighborhoods. Let x represent the total number of jobs in a given neighborhood, and let y represent the number of entry-level jobs in the same neighborhood. A sample of six Denver neighborhoods gave the following information (units in hundreds of jobs). X 17 35 53 28 SO 25 2 36 593 Complete parts (a) through (e), given Ex = 208, Ly - 28, 2x - 3232, LV-164, Exy = 1122,...
Most questions answered within 3 hours.
-
The population of bacteria in a culture can be modeled by P left
parenthesis t right...
asked 1 minute ago -
Which factors can prevent permanent fixation of an allele (i.e.
maintain genetic diversity)? Hint: You're going...
asked 3 minutes ago -
Compare a two-year bond with two successive one-year bonds in a
situation in which an investor...
asked 24 minutes ago -
Chapter 6
Search the internet and find a newspaper example of a price
ceiling, price floor...
asked 19 minutes ago -
Sarah Bates, calendar year taxpayer, started a new business on
October 8th. A number of start-up...
asked 20 minutes ago -
You and your friends are playing in the swimming pool with a
40-cm-diameter beach ball. How...
asked 25 minutes ago -
Patterson Development sometimes sells property on an installment
basis. In those cases, Patterson reports income in...
asked 37 minutes ago -
please help with these two example, i want to double check my
work. thanks
1.
sum:=0...
asked 34 minutes ago -
in the formation of 1.0 mole of the following crystalline solids
from the gaseous ions most...
asked 40 minutes ago -
Please answer Letter G only.
Price
Quantity
TR
MR
MC
TC
Profit
$15,000
0
0
----...
asked 41 minutes ago -
You are required to develop and submit a 12-month integrated
marketing communications plan for the KFC...
asked 43 minutes ago -
Let v=(1,-4,12) and w=(3,5,-1) be vectors.
What is 2v-3w?
asked 59 minutes ago