Do heavier cars really use more gasoline? Suppose a car is chosen at random. Let x be the weight of the car (in hundreds of pounds), and let y be the miles per gallon (mpg). x 29 44 33 47 23 40 34 52...
Do heavier cars really use more gasoline? Suppose a car is chosen at random. Let x be the weight of the car (in hundreds of pounds), and let y be the miles per gallon (mpg). x 29 44 33 47 23 40 34 52 y 32 20 26 13 29 17 21 14 Complete parts (a) through (e), given Σx = 302, Σy = 172, Σx2 = 12,064, Σy2 = 4036, Σxy = 6066, and r ≈ −0.902. (a) Draw a scatter diagram displaying the data. Flash Player version 10 or higher is required for this question. You can get Flash Player free from Adobe's website. (b) Verify the given sums Σx, Σy, Σx2, Σy2, Σxy, and the value of the sample correlation coefficient r. (Round your value for r to three decimal places.) Σx = Σy = Σx2 = Σy2 = Σxy = r = (c) Find x, and y. Then find the equation of the least-squares line = a + bx. (Round your answers for x and y to two decimal places. Round your answers for a and b to three decimal places.) x = y = = + x (d) Graph the least-squares line. Be sure to plot the point (x, y) as a point on the line. (e) Find the value of the coefficient of determination r2. What percentage of the variation in y can be explained by the corresponding variation in x and the least-squares line? What percentage is unexplained? (Round your answer for r2 to three decimal places. Round your answers for the percentages to one decimal place.) r2 = explained % unexplained % (f) Suppose a car weighs x = 45 (hundred pounds). What does the least-squares line forecast for y = miles per gallon? (Round your answer to two decimal places.) mpg
Homework Answers
Answer a)

Answer b)
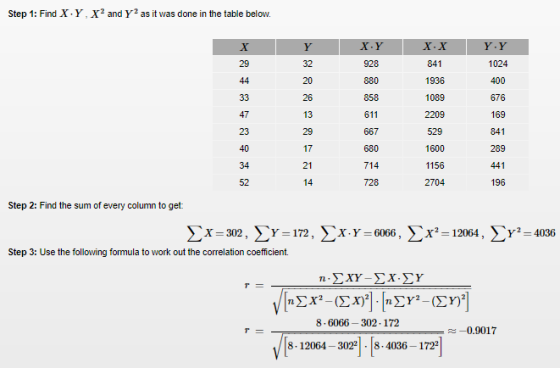
Based on above calculation values are as follows:
Σx = 302
Σy = 172
Σx2 = 12064
Σy2 = 4036
Σxy = 6066
r = −0.902
Answer c)
Following is the calculation of for y-intercept (a) and slope (b):

Answer d)
Following is graph showing regression line:

Answer e)
Coefficient of Determination r2 = -0.902*-0.902 = 0.813
Interpretation
Since coefficient of determination is 0.813, so it can be said that 81.3% percentage of the variation in y can be explained by the corresponding variation in x.
The percentage of variation that is unexplained = 100 - 81.3% = 18.7%
Answer f)
At x = 45, we can predict y using regression equation:
y = 45.794 - 0.644*45
y = 16.814
y = 16.81 miles per gallon
Add Answer to:
Do heavier cars really use more gasoline? Suppose a car is chosen at random. Let x be the weight of the car (in hundreds of pounds), and let y be the miles per gallon (mpg). x 29 44 33 47 23 40 34 52...
Do heavier cars really use more gasoline? Suppose a car is chosen at random. Let x...
Do heavier cars really use more gasoline? Suppose a car is chosen at random. Let x be the weight of the car (in hundreds of pounds), and let y be the miles per gallon (mpg). x 30 43 31 47 23 40 34 52 y 30 21 22 13 29 17 21 14 Complete parts (a) through (e), given Σx = 300, Σy = 167, Σx2 = 11,908, Σy2 = 3761, Σxy = 5885, and r ≈ −0.888. (a) Draw...
Let x be per capita income in thousands of dollars. Let y be the number of medical doctors per 10,000 residents. Six small cities in Oregon gave the following information about x and y. x 8.2 9.7 10.0...
Let x be per capita income in thousands of dollars. Let y be the number of medical doctors per 10,000 residents. Six small cities in Oregon gave the following information about x and y. x 8.2 9.7 10.0 8.0 8.3 8.7 y 9.5 18.7 20.2 10.2 11.4 13.1 Complete parts (a) through (e), given Σx = 52.9, Σy = 83.1, Σx2 = 469.91, Σy2 = 1253.59, Σxy = 751.48, and r ≈ 0.991. (a) Draw a scatter diagram displaying the...
It is thought that basketball teams that make too many fouls in a game tend to lose the game even if they otherwise play well. Let x be the number of fouls more than (i.e., over and above) the opposin...
It is thought that basketball teams that make too many fouls in a game tend to lose the game even if they otherwise play well. Let x be the number of fouls more than (i.e., over and above) the opposing team. Let y be the percentage of times the team with the larger number of fouls wins the game. x 1 2 5 6 y 48 42 33 26 Complete parts (a) through (e), given Σx = 14, Σy =...
Let x be the age of a licensed driver in years. Let y be the percentage...
Let x be the age of a licensed driver in years. Let y be the percentage of all fatal accidents (for a given age) due to failure to yield the right of way. For example, the first data pair states that 5% of all fatal accidents of 37-year-olds are due to failure to yield the right of way. x 37 47 57 67 77 87 y 5 8 10 17 33 42 Complete parts (a) through (e), given Σx =...
7. Do heavier cars really use more gasoline? Suppose a car is chosen at random. Let x be the weight of the car (in hundreds of pounds), and let y be the miles per gallon (mpg) At the 5% level of sign...
 7. Do heavier cars really use more gasoline? Suppose a car is chosen at random. Let x be the weight of the car (in hundreds of pounds), and let y be the miles per gallon (mpg) At the 5% level of significance, test the claim is that heavier cars use more gasoline. Remember that a claim of correlation would be that X 29 46 29 47 23 40 34 52 Y 30 21 22 14 29 27 22 34 a....
You are the foreman of the Bar-S cattle ranch in Colorado. A neighboring ranch has calves...
You are the foreman of the Bar-S cattle ranch in Colorado. A neighboring ranch has calves for sale, and you are going to buy some calves to add to the Bar-S herd. How much should a healthy calf weigh? Let x be the age of the calf (in weeks), and let y be the weight of the calf (in kilograms). x 3 4 8 16 26 36 y 45 53 75 100 150 200 Complete parts (a) through (e), given...
Let x be the percentage of 16- to 19-year-olds not in school and not high school...
Let x be the percentage of 16- to 19-year-olds not in school and not high school graduates. Let y be the reported violent crimes per 1000 residents. Six small cities in Arkansas (Blytheville, El Dorado, Hot Springs, Jonesboro, Rogers, and Russellville) reported the following information about x and y. x 24.5 19.0 18.5 14.9 19.0 17.5 y 12.9 4.8 8.6 1.3 0.8 3.6 Complete parts (a) through (e), given Σx = 113.4, Σy = 32, Σx2 = 2192.76, Σy2 =...
1. Suppose you are interested in buying a new Lincoln Navigator or Town Car. You are...
1. Suppose you are interested in buying a new Lincoln Navigator or Town Car. You are standing on the sales lot looking at a model with different options. The list price is on the vehicle. As a salesperson approaches, you wonder what the dealer invoice price is for this model with its options. The following data are based on a random selection of these cars of different models and options. Let y be the dealer invoice (in thousands of dollars)...
he follo 2. Do heavier cars really use more gasoline? Suppose that a car is chosen...
 he follo 2. Do heavier cars really use more gasoline? Suppose that a car is chosen at random. Let x be the weight of the car (in pounds), and let y be the miles per gallon (mpg). The following information is based on data taken from Consumer Reports (vol. 62, no. 4). cystolic 3400 5200 21 14 - Weight of Car (in pounds) 2700 4400 3200 4700 2300 4000 y-Miles per Gallon 30 19 24 13 29 17 . Find...
Let x be a random variable representing percentage change in neighborhood population in the past few...
Let x be a random variable representing percentage change in neighborhood population in the past few years, and let y be a random variable representing crime rate (crimes per 1000 population). A random sample of six neighborhoods gave the following information. x 29 4 11 17 7 6 y 176 40 132 127 69 53 Σx = 74, Σy = 597, Σx2 = 1352, Σy2 = 73,699, and Σxy = 9,676 (b) Find x, y, b, and the equation of...
 7. Do heavier cars really use more gasoline? Suppose a car is chosen at random. Let x be the weight of the car (in hundreds of pounds), and let y be the miles per gallon (mpg) At the 5% level of significance, test the claim is that heavier cars use more gasoline. Remember that a claim of correlation would be that X 29 46 29 47 23 40 34 52 Y 30 21 22 14 29 27 22 34 a....
 he follo 2. Do heavier cars really use more gasoline? Suppose that a car is chosen at random. Let x be the weight of the car (in pounds), and let y be the miles per gallon (mpg). The following information is based on data taken from Consumer Reports (vol. 62, no. 4). cystolic 3400 5200 21 14 - Weight of Car (in pounds) 2700 4400 3200 4700 2300 4000 y-Miles per Gallon 30 19 24 13 29 17 . Find...
Most questions answered within 3 hours.
-
Living in a group could bring several disadvantages to an
individual. What are some of the...
asked 1 minute ago -
Complete and balance the following reactions. In case of no
reaction occurring write NR.
Mix #1:...
asked 6 minutes ago -
If an economy consumes 75% of any increase in income, then an
increase in autonomous investment...
asked 10 minutes ago -
A shotputter throws the shot with an initial speed of 15.8 m/s
at a 38.0 ∘...
asked 25 minutes ago -
Debra and Merina sell electronic equipment and supplies through
their partnership. They wish to expand their...
asked 26 minutes ago -
How does a linear regression allow you to better estimate
trends, costs, and other factors in...
asked 34 minutes ago -
1. (15%) Describe the difference between a pull (Kanban), push
and CONWIP production systems.
asked 30 minutes ago -
QUESTION 5
The total area under the Z distribution curve is equal to:
a.
10
b....
asked 39 minutes ago -
Using Python
The variables x and y refer to numbers. Write a code segment
that prompts...
asked 53 minutes ago -
If
the coefficient of static friction between a box and the floor is
0.35 with what...
asked 56 minutes ago -
A die is designed to punch holes with a radius of 1.08 10-2 m in
a...
asked 1 hour ago -
government can increase import through
a. export subsidies
b. tax breaks
c. increase import tax
d....
asked 1 hour ago