
Homework Answers


Add Answer to:
The table shows distance of ball throw (y), grip (x1), stature (x2) and weight (x3) about...
The table shows distance of ball throw (y), grip (x1), stature (x2) and weight (x3) about...
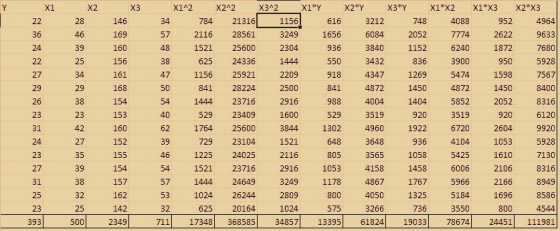
 The table shows distance of ball throw (y), grip (x1), stature (x2) and weight (x3) about fifteen boys Derive a multiple regression formula and its multiple correlation coefficient about objective variable that is distance of ball throw (y) Furthermore, derive distance of 10 ball y [m] about a x1-45[kg], x2=158[cm] and x3=60[kg] by using the multiple regression formula Stature Weight| Grip boll throw y[m] x1[kg]x2cm] x3[kg] Distance of 34 22 28 146 36 57 46 169 24 39 25 160...
3. A hospital administrator wished to study the relation between patient satisfaction (Y) and pat...
 solvel only E F G H
below is pat data
3. A hospital administrator wished to study the relation between patient satisfaction (Y) and patients age (Xi, in years), severity of illness (X2, an index) and anxiety level (X3, an index). The administrator randomly selected 23 patients and collected the data in pat, where larger values of Y, X2 and X3 are, respectively, associated with more satisfaction, increased severity of illness and more anxiety. The data is saved in Moodle2...
solvel only E F G H
below is pat data
3. A hospital administrator wished to study the relation between patient satisfaction (Y) and patients age (Xi, in years), severity of illness (X2, an index) and anxiety level (X3, an index). The administrator randomly selected 23 patients and collected the data in pat, where larger values of Y, X2 and X3 are, respectively, associated with more satisfaction, increased severity of illness and more anxiety. The data is saved in Moodle2...
Please use Excel, and show all functions. 3. Answer the following question for where Y has...
 Please use Excel, and show all functions.
3. Answer the following question for where Y has been regressed on X1, X2, and X3. Use the linear regression output in the Excel file. Your answers should be rounded to 2 decimal places. a. What is the equation for the line of best fit or regression line? b. The proportion is for the amount of the variability of Y that is explained or accounted for by the model. C. The correlation between...
Please use Excel, and show all functions.
3. Answer the following question for where Y has been regressed on X1, X2, and X3. Use the linear regression output in the Excel file. Your answers should be rounded to 2 decimal places. a. What is the equation for the line of best fit or regression line? b. The proportion is for the amount of the variability of Y that is explained or accounted for by the model. C. The correlation between...
The accompanying table provides data for the sex, age, and weight of bears. For sex, let...
 The accompanying table provides data for the sex, age, and weight of bears. For sex, let 0 represent female and let 1 represent male. Letting the response (y) varieble represent weight, use the dummy variable of sex and the variable of age and to find the multiple regression equation, Use the equation to find the predicted weight of a bear with the characteristics given below. Does sex appear to have much of an effect on the weight of a bear?...
You believe that ‘Purchase intention’ about a product of the consumer will be dependent on the...
You believe that ‘Purchase intention’ about a product of the consumer will be dependent on the ‘skepticism’ of the consumer towards the brand. Run the appropriate analysis for the problem using the following dataset and answer the following 1A - 1D: DATA SET ID Purchase Intention Skepticism 1 6 1 2 5.5 1 3 5 1 4 7 1 5 1 5 6 2 5 7 2 5 8 3 5 9 1 5 10 1 5 11 3.5 5 12...
In this exercise, you will investigate the relationship between growth and trade. The following table contains...
 In this exercise, you will investigate the relationship between growth and trade. The following table contains data on average growth rates from 1960 through 1995 for 20 countries along with variables that are potentially related to growth. Download the data from the table by clicking the download table icon . A detailed description of the variables used in the data set is available here . Use a statistical package of your choice to answer the following questions. Run a regression...
We assume that our wages will increase as we gain experience and become more valuable to our employers. Wages also incre...
We assume that our wages will increase as we gain experience and become more valuable to our employers. Wages also increase because of inflation. By examining a sample of employees at a given point in time, we can look at part of the picture. How does length of service (LOS) relate to wages? The data here (data393.dat) is the LOS in months and wages for 60 women who work in Indiana banks. Wages are yearly total income divided by the...
We assume that our wages will increase as we gain experience and become more valuable to...
We assume that our wages will increase as we gain experience and become more valuable to our employers. Wages also increase because of inflation. By examining a sample of employees at a given point in time, we can look at part of the picture. How does length of service (LOS) relate to wages? The data here (data303.dat) is the LOS in months and wages for 60 women who work in Indiana banks. Wages are yearly total income divided by the...
INN MARGIN ROOMS NEAREST OFFICE COLLEGE INCOME DISTTWN 1 44.2 3471 2.1 523 12 35 9.4...
 INN
MARGIN
ROOMS
NEAREST
OFFICE
COLLEGE
INCOME
DISTTWN
1
44.2
3471
2.1
523
12
35
9.4
2
29.8
3567
1.8
140
13.5
42
5.7
3
38.4
3264
1.6
404
22.5
45
4.4
4
54.4
3234
1.1
649
19.5
35
6.5
5
34.5
2730
4
171
17
41
10.5
6
44.9
3003
3.4
402
15.5
37
4.6
7
46
2341
2
580
23
45
7.4
8
50.2
3021
2.6
572
8.5
33
9.3
9
46
2655
3.2
666
22
40
6.7...
INN
MARGIN
ROOMS
NEAREST
OFFICE
COLLEGE
INCOME
DISTTWN
1
44.2
3471
2.1
523
12
35
9.4
2
29.8
3567
1.8
140
13.5
42
5.7
3
38.4
3264
1.6
404
22.5
45
4.4
4
54.4
3234
1.1
649
19.5
35
6.5
5
34.5
2730
4
171
17
41
10.5
6
44.9
3003
3.4
402
15.5
37
4.6
7
46
2341
2
580
23
45
7.4
8
50.2
3021
2.6
572
8.5
33
9.3
9
46
2655
3.2
666
22
40
6.7...
Using the answers from the table above, answer ALL of the questions below. For questions 1 - 13, draw a normal curve and indicate the area that you are calculating the probability of. For questions...
 Using the answers from the table above, answer ALL of
the questions below. For questions 1 - 13, draw a
normal curve and indicate the area that you are calculating the
probability of. For questions 14 – 22, use the
appropriate formulas and show all of your
calculations.
Be sure to turn in the table above along with your
answers to all of the questions below. Place your answers in a
folder with your name clearly written at the top...
Using the answers from the table above, answer ALL of
the questions below. For questions 1 - 13, draw a
normal curve and indicate the area that you are calculating the
probability of. For questions 14 – 22, use the
appropriate formulas and show all of your
calculations.
Be sure to turn in the table above along with your
answers to all of the questions below. Place your answers in a
folder with your name clearly written at the top...
 The table shows distance of ball throw (y), grip (x1), stature (x2) and weight (x3) about fifteen boys Derive a multiple regression formula and its multiple correlation coefficient about objective variable that is distance of ball throw (y) Furthermore, derive distance of 10 ball y [m] about a x1-45[kg], x2=158[cm] and x3=60[kg] by using the multiple regression formula Stature Weight| Grip boll throw y[m] x1[kg]x2cm] x3[kg] Distance of 34 22 28 146 36 57 46 169 24 39 25 160...
 solvel only E F G H
below is pat data
3. A hospital administrator wished to study the relation between patient satisfaction (Y) and patients age (Xi, in years), severity of illness (X2, an index) and anxiety level (X3, an index). The administrator randomly selected 23 patients and collected the data in pat, where larger values of Y, X2 and X3 are, respectively, associated with more satisfaction, increased severity of illness and more anxiety. The data is saved in Moodle2...
solvel only E F G H
below is pat data
3. A hospital administrator wished to study the relation between patient satisfaction (Y) and patients age (Xi, in years), severity of illness (X2, an index) and anxiety level (X3, an index). The administrator randomly selected 23 patients and collected the data in pat, where larger values of Y, X2 and X3 are, respectively, associated with more satisfaction, increased severity of illness and more anxiety. The data is saved in Moodle2...
 Please use Excel, and show all functions.
3. Answer the following question for where Y has been regressed on X1, X2, and X3. Use the linear regression output in the Excel file. Your answers should be rounded to 2 decimal places. a. What is the equation for the line of best fit or regression line? b. The proportion is for the amount of the variability of Y that is explained or accounted for by the model. C. The correlation between...
Please use Excel, and show all functions.
3. Answer the following question for where Y has been regressed on X1, X2, and X3. Use the linear regression output in the Excel file. Your answers should be rounded to 2 decimal places. a. What is the equation for the line of best fit or regression line? b. The proportion is for the amount of the variability of Y that is explained or accounted for by the model. C. The correlation between...
 The accompanying table provides data for the sex, age, and weight of bears. For sex, let 0 represent female and let 1 represent male. Letting the response (y) varieble represent weight, use the dummy variable of sex and the variable of age and to find the multiple regression equation, Use the equation to find the predicted weight of a bear with the characteristics given below. Does sex appear to have much of an effect on the weight of a bear?...
 In this exercise, you will investigate the relationship between growth and trade. The following table contains data on average growth rates from 1960 through 1995 for 20 countries along with variables that are potentially related to growth. Download the data from the table by clicking the download table icon . A detailed description of the variables used in the data set is available here . Use a statistical package of your choice to answer the following questions. Run a regression...
 INN
MARGIN
ROOMS
NEAREST
OFFICE
COLLEGE
INCOME
DISTTWN
1
44.2
3471
2.1
523
12
35
9.4
2
29.8
3567
1.8
140
13.5
42
5.7
3
38.4
3264
1.6
404
22.5
45
4.4
4
54.4
3234
1.1
649
19.5
35
6.5
5
34.5
2730
4
171
17
41
10.5
6
44.9
3003
3.4
402
15.5
37
4.6
7
46
2341
2
580
23
45
7.4
8
50.2
3021
2.6
572
8.5
33
9.3
9
46
2655
3.2
666
22
40
6.7...
INN
MARGIN
ROOMS
NEAREST
OFFICE
COLLEGE
INCOME
DISTTWN
1
44.2
3471
2.1
523
12
35
9.4
2
29.8
3567
1.8
140
13.5
42
5.7
3
38.4
3264
1.6
404
22.5
45
4.4
4
54.4
3234
1.1
649
19.5
35
6.5
5
34.5
2730
4
171
17
41
10.5
6
44.9
3003
3.4
402
15.5
37
4.6
7
46
2341
2
580
23
45
7.4
8
50.2
3021
2.6
572
8.5
33
9.3
9
46
2655
3.2
666
22
40
6.7...
 Using the answers from the table above, answer ALL of
the questions below. For questions 1 - 13, draw a
normal curve and indicate the area that you are calculating the
probability of. For questions 14 – 22, use the
appropriate formulas and show all of your
calculations.
Be sure to turn in the table above along with your
answers to all of the questions below. Place your answers in a
folder with your name clearly written at the top...
Using the answers from the table above, answer ALL of
the questions below. For questions 1 - 13, draw a
normal curve and indicate the area that you are calculating the
probability of. For questions 14 – 22, use the
appropriate formulas and show all of your
calculations.
Be sure to turn in the table above along with your
answers to all of the questions below. Place your answers in a
folder with your name clearly written at the top...
Most questions answered within 3 hours.
-
What kind of materials are found in Leviticus? Give a simple
description of this book. Also...
asked 15 minutes ago -
17.1 Energy drink commercials. A study was designed to compare
Red Bull energy drink commercials. Each...
asked 19 minutes ago -
The life that maximizes net present value and shareholder wealth
is known as...
Physical Life
Economic...
asked 43 minutes ago -
You have to write your code in C++ (as a cpp file) and prepare a
docx...
asked 1 hour ago -
Why does the spectrum of bromocresol green changes at different
pHs? What causes the change?
asked 1 hour ago -
Rice Company has a unit selling price of $690, variable costs
per unit of $390, and...
asked 2 hours ago -
The DeVille Company reported pretax accounting
income on its income statement as follows:
2018
$
425,000...
asked 2 hours ago -
Argue for or against the "Three Strikes"laws. Provide a rationale
to support your response.
asked 3 hours ago -
Bargaining Models: what is the "Obsolescing Bargain"?
Bargaining Models: what are the factors that would tend...
asked 4 hours ago -
1. A ball is thrown up into the air.
a) Draw motion diagram and the point-like...
asked 4 hours ago -
1) Because money eliminates the "double coincidence of wants"
problem, the development of money as a...
asked 5 hours ago -
Company AAA produces only one product which other manufacturers
purchase as a component for their final...
asked 7 hours ago