
Player ERA So/IP R/IP Team W L HR/IP 24 5 2.41 1.00 0.11 0.28 Verlander, J DET 13 0.10 0.34 7 2.89 0.91 BOS Beckett, J 16 7 2.93 0.92 0.07 0.41 Wilson, C TEX 19 3.01 0.98 0.06 0.37 Sabathia, C NYY 16 10 3.18 0.80 0.07 0.39 Haren, D LAA 0.42 3.33 0.72 0.05 McCarthy, B OAK 11 12 3.37 0.78 0.10 0.41 Santana, E LAA 0.94 15 3.46 0.11 0.39 Lester, J BOS 0.09 14 14 3.46 0.95 0.41 Hernandez, F SEA 13 3.60 0.53 0.10 0.46 CWS Buehrle, M 0.12 0.43 10 3.75 1.00 Pineda, M SEA 8 10 4.01 0.82 0.13 0.53 Colon, B NYY 12 4.25 0.53 0.16 0.49 CLE Tomlin, 13 4.29 0.46 0.10 0.55 Pavano, C MIN 8 0.78 0.12 0.52 12 4.32 Danks, J CWS 9 17 4.34 0.63 0.13 0.53 Guthrie, J BAL 14 10 4.41 0.85 0.17 0.52 Lewis, C TEX 0.88 0.14 0.52 15 9 4.43 DET Scherzer, M 0.12 11 10 4.44 0.56 0.51 Davis, W TE 4.75 0.10 14 9 0.58 0.57 Porcello, R DET
a. What are the values of R and R (to 3 decimals), if the average number of runs is the dependent variable and the average number strikeouts per inning pitched and the average number of home runs per inning pitched are the independent variables. Enter negative value as negative number. R/IP =0.552 -0.265 sO/IP HR/IP 1.017 R2 = 0.602 R2 0.555 b. Does the estimated regression equation provide good fit to the data? Explain. (to 1 decimal) of the variability in the number of runs given up per inning pitched. because the nature of the data able to explain The fit is not bad c. Suppose the earned run average (ERA) is used as the dependent variable in part (a) instead of the average number of runs given up per inning pitch ed. What are the values of R2 and R? (to 3 decimals). Enter negative value as negative number. % So/IP HR/IP ERA R2 0.563 R2=0.512 Does the estimated regression equation provide a good fit to the data? Explain. (to 1 decimal) % of the variability in the ERA The fit is not bad because the nature of the data is able to explain
Homework Answers
| SUMMARY OUTPUT | ||||||||
| Regression Statistics | ||||||||
| Multiple R | 0.758632808 | |||||||
| R Square | 0.575523737 | |||||||
| Adjusted R Square | 0.525585353 | |||||||
| Standard Error | 0.054228651 | |||||||
| Observations | 20 | |||||||
| ANOVA | ||||||||
| df | SS | MS | F | Significance F | ||||
| Regression | 2 | 0.067782308 | 0.033891154 | 11.52467687 | 0.000686679 | |||
| Residual | 17 | 0.049992692 | 0.002940747 | |||||
| Total | 19 | 0.117775 | ||||||
| Coefficients | Standard Error | t Stat | P-value | Lower 95% | Upper 95% | Lower 95.0% | Upper 95.0% | |
| Intercept | 0.552756845 | 0.077706048 | 7.113433974 | 1.738E-06 | 0.388811415 | 0.716702275 | 0.388811415 | 0.716702275 |
| SO/IP | -0.264414757 | 0.071814506 | -3.681912917 | 0.001849044 | -0.415930119 | -0.112899395 | -0.415930119 | -0.112899395 |
| HR/IP | 0.988382143 | 0.407979736 | 2.422625577 | 0.026866574 | 0.127620149 | 1.849144137 | 0.127620149 | 1.849144137 |
a)
R/IP = 0.552 - 0.264 * SO/IP + 0.988 * HR/IP
R Square = 0.575
Adjusted R Square = 0.525
b)
The fit is not bad, because the nature of the data is able to explain 52.5% of the variability in the number of runs given up per inning pitched
c)
| SUMMARY OUTPUT | ||||||||
| Regression Statistics | ||||||||
| Multiple R | 0.793797666 | |||||||
| R Square | 0.630114734 | |||||||
| Adjusted R Square | 0.586598821 | |||||||
| Standard Error | 0.423448366 | |||||||
| Observations | 20 | |||||||
| ANOVA | ||||||||
| df | SS | MS | F | Significance F | ||||
| Regression | 2 | 5.192810183 | 2.596405092 | 14.48009895 | 0.000213093 | |||
| Residual | 17 | 3.048244817 | 0.179308519 | |||||
| Total | 19 | 8.241055 | ||||||
| Coefficients | Standard Error | t Stat | P-value | Lower 95% | Upper 95% | Lower 95.0% | Upper 95.0% | |
| Intercept | 4.045311972 | 0.606773332 | 6.666924462 | 3.96996E-06 | 2.765132155 | 5.32549179 | 2.765132155 | 5.32549179 |
| SO/IP | -1.934653148 | 0.560768794 | -3.450001443 | 0.003058094 | -3.117771873 | -0.751534422 | -3.117771873 | -0.751534422 |
| HR/IP | 11.13629894 | 3.185739449 | 3.495671607 | 0.002769917 | 4.414976283 | 17.85762159 | 4.414976283 | 17.85762159 |
ERA = 4.045 - 1.935 * SO/IP + 11.136 * HR/IP
R Square = 0.630
Adjusted R Square = 0.586
The fit is not bad, because the nature of the data is able to explain 58.6% of the variability in the ERA
Add Answer to:
Major League Baseball (MLB) consists of teams that play in the American League and the National...
Check Major League Baseball (MLB) consists of teams that play in the American League and the...
 Check Major League Baseball (MLB) consists of teams that play in the American League and the National League. MLB collects a wide variety of team and player statistics. Some of the often used to evaluate pitching performance are as follows: • ERA: The average number of earned runs given up by the pitcher per nine innings. An earned run is any run that the opponent scores off a particular pitcher except for runs result of errors. SO/IP: The average number...
A statistcal pregram is recommended Major League Baseball [MLB) pitching statistics were reported...
 A statistcal pregram is recommended Major League Baseball [MLB) pitching statistics were reported for ฉิ random sample of 20 pitchers from the American League for one full season. Player Team L ERA SO/IP HR/IP R/IP Verlander, J Beckett, Wison, C Sabathia, C NYY Haren, D McCarthy, OAK 993.32 0.72 0.06 0.43 Santans, E Lester, ) Hernande, F SEA 1414 3.47 095 008 0.42 Buehrle, M Pineda, M Colon, B Tomlin, Pavano, C Danks, ) Guthrie, Lewis, C Scherzer, M Davis,...
939683291542851 233334434445455 0116 IF 0 0 0 0 0 0 0 0 0 0 0 0 0 0 0 0 0 0 0 0 90777619800250026520 91270275420236933976 99998779950854768855 100000000001000000000 09306287694049230345 4890133445702...
 939683291542851 233334434445455 0116 IF 0 0 0 0 0 0 0 0 0 0 0 0 0 0 0 0 0 0 0 0 90777619800250026520 91270275420236933976 99998779950854768855 100000000001000000000 09306287694049230345 48901334457022334447 22233333333444444444 57780929490073270909 1 1 1 1 43696915439829894514 1 ENE MBJ.JJC er, W lo, nns e is e eui de oaau Major League Baseball (MLB) consists of teams that play in the American League and the National League. MLB collects a wide variety of team and player statistics. Some of the...
A statistical program is recommended. Data showing the values of several pitching statistics for a random...
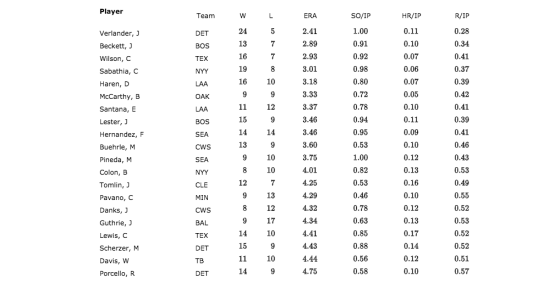
A statistical program is recommended. Data showing the values of several pitching statistics for a random sample of 20 pitchers from the American League of Major League Baseball is provided. Player Team W L ERA SO/IP HR/IP R/IP Verlander, J DET 24 5 2.40 1.00 0.10 0.29 Beckett, J BOS 13 7 2.89 0.91 0.11 0.34 Wilson, C TEX 16 7 2.94 0.92 0.07 0.40 Sabathia, C NYY 19 8 3.00 0.97 0.07 0.37 Haren, D LAA 16 10 3.17...
Data showing the values of several pitching statistics for a random sample of 20 pitchers from...
 Data showing the values of several pitching statistics for a random sample of 20 pitchers from the American League of Major League Baseball is provided. Player HR/IP R/IP 0.10 0.29 0.11 0.34 0.07 0.40 Beckett, Wilson, C Sabathia, 0.07 0.37 Team DET Bos | TEX NYY LAA OAK LAA BOS SEA SEA W ERA SO/IP 245 2.00 1.00 0.91 16 0.92 0.97 0.81 0.72 11 12 0.78 15 3.47 0.95 -4 -4 2.47 0.95 Haren, D 16 10 McCarthy, B...
3) American League baseball teams play their games with the designated hitter rule, meaning that pitchers...
 3) American League baseball teams play their games with the designated hitter rule, meaning that pitchers do not bat. The league believes that replacing the pitcher, typically a weak hitter, with another player in the batting order produces more runs. Using a significance level of a = 0.05, determine if the average number of runs is higher for the American League Following are the average number of runs scored by each team in the 2016 season: American League National League...
Jeff Sagarin has been providing sports ratings for USA Today since 1985. In baseball, his predicted...
 Jeff Sagarin has been providing sports ratings for USA Today
since 1985. In baseball, his predicted RPG (runs per game)
statistics considers the entire player’s offensive statistics and
is claimed to be the best measure of a player’s true offensive
value. A set of sample data was collected for RPG and a variety of
offensive statistics for a recent Major League Baseball (MLB)
season for members of the New York Yankees. The variables are
defined as follows: RPG, predicted runs...
Jeff Sagarin has been providing sports ratings for USA Today
since 1985. In baseball, his predicted RPG (runs per game)
statistics considers the entire player’s offensive statistics and
is claimed to be the best measure of a player’s true offensive
value. A set of sample data was collected for RPG and a variety of
offensive statistics for a recent Major League Baseball (MLB)
season for members of the New York Yankees. The variables are
defined as follows: RPG, predicted runs...
[USING RSTUDIO] I am having trouble already in step 3 of number 1. Im not sure...
[USING RSTUDIO] I am having trouble already in step 3 of number 1. Im not sure why what I typed isn't working. I appreciate anybody that can help me out. Thanks 1. Recall the `iris` data set from last week's exercise. The `iris` data set is already pre-loaded in R - look at the help file using `?iris` for more information on this data set. i) Check the structure of the data using the function `str(iris)`. ii) Find...
 Check Major League Baseball (MLB) consists of teams that play in the American League and the National League. MLB collects a wide variety of team and player statistics. Some of the often used to evaluate pitching performance are as follows: • ERA: The average number of earned runs given up by the pitcher per nine innings. An earned run is any run that the opponent scores off a particular pitcher except for runs result of errors. SO/IP: The average number...
 A statistcal pregram is recommended Major League Baseball [MLB) pitching statistics were reported for ฉิ random sample of 20 pitchers from the American League for one full season. Player Team L ERA SO/IP HR/IP R/IP Verlander, J Beckett, Wison, C Sabathia, C NYY Haren, D McCarthy, OAK 993.32 0.72 0.06 0.43 Santans, E Lester, ) Hernande, F SEA 1414 3.47 095 008 0.42 Buehrle, M Pineda, M Colon, B Tomlin, Pavano, C Danks, ) Guthrie, Lewis, C Scherzer, M Davis,...
 939683291542851 233334434445455 0116 IF 0 0 0 0 0 0 0 0 0 0 0 0 0 0 0 0 0 0 0 0 90777619800250026520 91270275420236933976 99998779950854768855 100000000001000000000 09306287694049230345 48901334457022334447 22233333333444444444 57780929490073270909 1 1 1 1 43696915439829894514 1 ENE MBJ.JJC er, W lo, nns e is e eui de oaau Major League Baseball (MLB) consists of teams that play in the American League and the National League. MLB collects a wide variety of team and player statistics. Some of the...
 Data showing the values of several pitching statistics for a random sample of 20 pitchers from the American League of Major League Baseball is provided. Player HR/IP R/IP 0.10 0.29 0.11 0.34 0.07 0.40 Beckett, Wilson, C Sabathia, 0.07 0.37 Team DET Bos | TEX NYY LAA OAK LAA BOS SEA SEA W ERA SO/IP 245 2.00 1.00 0.91 16 0.92 0.97 0.81 0.72 11 12 0.78 15 3.47 0.95 -4 -4 2.47 0.95 Haren, D 16 10 McCarthy, B...
 3) American League baseball teams play their games with the designated hitter rule, meaning that pitchers do not bat. The league believes that replacing the pitcher, typically a weak hitter, with another player in the batting order produces more runs. Using a significance level of a = 0.05, determine if the average number of runs is higher for the American League Following are the average number of runs scored by each team in the 2016 season: American League National League...
 Jeff Sagarin has been providing sports ratings for USA Today
since 1985. In baseball, his predicted RPG (runs per game)
statistics considers the entire player’s offensive statistics and
is claimed to be the best measure of a player’s true offensive
value. A set of sample data was collected for RPG and a variety of
offensive statistics for a recent Major League Baseball (MLB)
season for members of the New York Yankees. The variables are
defined as follows: RPG, predicted runs...
Jeff Sagarin has been providing sports ratings for USA Today
since 1985. In baseball, his predicted RPG (runs per game)
statistics considers the entire player’s offensive statistics and
is claimed to be the best measure of a player’s true offensive
value. A set of sample data was collected for RPG and a variety of
offensive statistics for a recent Major League Baseball (MLB)
season for members of the New York Yankees. The variables are
defined as follows: RPG, predicted runs...
Most questions answered within 3 hours.
-
If you titrated 30.0 mL of 0.1 M HCl with 0.1 M NaOH, indicate
the approximate...
asked 3 seconds ago -
NADH passes electrons into the electron transport chain. List
the carriers that would receive the electrons,...
asked 8 minutes ago -
A cylindrical cable with a resistivity of 1.6x10⁻⁸ Ω·m and cross
sectional area of 3x10⁻⁵ m^2...
asked 8 minutes ago -
True or False.
A consumer with convex preferences who is indifferent between
the bundles (5,2) and...
asked 11 minutes ago -
A diamond's index of refraction for red light, 656 nm, is 2.410,
while that for blue...
asked 24 minutes ago -
Compare HPLC, SPE, and GC. Identify the differences, the
advantages, and the weaknesses of each method.
asked 25 minutes ago -
Characteristic x-rays emitted by potassium have a wavelength of
0.374 nm. What is the energy of...
asked 28 minutes ago -
there is a function to create two random numbers between 1 and
25 and a function...
asked 46 minutes ago -
At a certain temperature, the ?pKp for the decomposition of
H2SH2S is 0.832.0.832.
H2S(g)↽−−⇀H2(g)+S(g)H2S(g)↽−−⇀H2(g)+S(g)
Initially, only...
asked 40 minutes ago -
Part 1.C&A Fast Food has four activities in serving a
customer: greet customer, take order, process...
asked 46 minutes ago -
Which attribute allows you to specify a custom "thumbnail" for
multimedia elements?
asked 1 hour ago -
How much 0.1200 M sodium hydroxide solution is need to titrate
14 mL of a 0.100...
asked 1 hour ago