(a) Find the five-number summary, and (b) draw a box-and-whisker plot of the data.
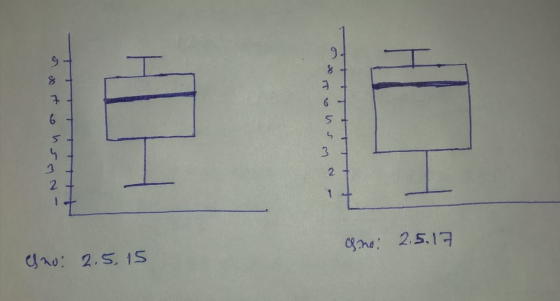
2.5.15 (a) Find the five-number summary, and (b) draw a box-and-whisker plot of the data.
3 8 8 6 2 9 8 7 9 6 9 5 2 6 29 8 7 79
(a) Min = _______ (Simplify your answer.)
2.5.17 (a) Find the five-number summary, and (b) draw a box-and-whisker plot of the data
3 8 8 4 2 987 969 3 16 29 8 7 79
(a) Min = _______
Homework Answers
We know that the five-number summary of the data gives the following thing as below:
Min_value,1st_quartile, Median, 3rd_quartile, Max_Value
2.5.15) Let us assume the data can be written as X: 3,8,8,6,2,9,8,7,9,6,9,5,2,6,2,9,8,7,7,9
To find the five-number summary, we have to arrange data in ascending order as below:
X1: 2 2 2 3 5 6 6 6 7 7 7 8 8 8 8 9 9 9 9 9, total no. of observation n=20, From the above X1,
Min_value=2, 1st quartile is n/4 i.e. 20/4=5th position number in X1 i.e.5, 3rd quartile is 3n/4 i.e. 3*20/4=15th position number in X1 i.e. 8, Median is n/2 i.e.20/2=10 position number in X1 is 7, Max_value is 9
Hence, five-number summary of X is obtained as, 2, 5, 7, 8, 9. Min_vaue is 2
2.5.17) Let us assume the data can be written as Y: 3,8,8,4,2,9,8,7,9,6,9,3,1,6,2,9,8,7,7,9
To find the five-number summary, we have to arrange data in ascending order as below:
X1: 1,2,2,3,3,4,6,6,7,7,7,8,8,8,8,9,9,9,9,9, total no. of observation n=20, From the above Z1
Min_value=1, 1st quartile is n/4 i.e. 20/4=5th position number in Z1 i.e.3, 3rd quartile is 3n/4 i.e. 3*20/4=15th position number in Z1 i.e. 8, Median is n/2 i.e.20/2=10 position number in Z1 is 7, Max_value is 9
Hence, five-number summary of Z is obtained as, 1, 3, 7, 8, 9. Min_vakue is 1
Box_plot in above two cases is given below:
Add Answer to:
(a) Find the five-number summary, and (b) draw a box-and-whisker plot of the data.
Use the box and whisker plot to identify (a) the five-number summary, and (b) the interquartle...
 Use the box and whisker plot to identify (a) the five-number summary, and (b) the interquartle range. 2134 12T 1438 1916 B00 1200 1500 1a00 10 (a) Min- Ma (b) 1QR-(simpity your answer) Enter yuur nnswar in each of the antwer boxeh neccrint.duFictriseR Tyue here to search Bad 3 U Y T R H D sehe lx ad whisker pat to aderty Ju) the fve sumber amy ( the rerquatle ca 134 217 1 7 CAM 6 la) Min May...
Use the box-and-whisker plot to identify the five-number summary
 Use the box-and-whisker plot to identify the five-number summary
3. Find five point summary and draw the box plot for the following data. Is the...
 3. Find five point summary and draw the box plot for the following data. Is the distribution skewed? On which side? (a) 4, 5, 2, 2, 4, 5, 3, 5, 6, 4 (b) 7.5, 5.5, 7.2, 2.8, 4.5, 3.7, 4.5,8.6,9.3, 6.6, 3.4.
Determine the 5 Number Summary for the following data for constructing a Box and Whisker plot:...
Determine the 5 Number Summary for the following data for constructing a Box and Whisker plot: 5, 10, 20, 15, 25, 30, 35, 40, 45, 40, 15, 50, 55, 60, 60, 75, 70 Enter the data in the proper numerical sequence with 1 decimal place precision, or an integer if appropriate, for each of the answers. You may use either the Lane or Illoswky procedure for determining the 5 Number Summary. Enter numbers from left to right.
Solve the following based off the following data: 1) Find P37 2) Five Point Summary 3)...
 Solve the following based off the following data:
1) Find P37
2) Five Point Summary
3) Box and Whisker Plot
4) Is this data normal?
6) Given 1 Find P37 2) Five point summary 3) Box and whisker plot 4 Is this data normal? 6 Hrowwnn e Wap funt vt Noore
Solve the following based off the following data:
1) Find P37
2) Five Point Summary
3) Box and Whisker Plot
4) Is this data normal?
6) Given 1 Find P37 2) Five point summary 3) Box and whisker plot 4 Is this data normal? 6 Hrowwnn e Wap funt vt Noore
A modified box-and-whisker plot is a box-and-whisker plot that uses symbols to identify outliers. The horizontal...
A modified box-and-whisker plot is a box-and-whisker plot that uses symbols to identify outliers. The horizontal line of a modified box-and-whisker plot extends as far as the minimum data entry that is not an outlier and the maximum data entry that is not an outlier. (a) Identify any outliers and (b) draw a modified box-and-whisker plot that represents the data set. 11,2,8,13,8,13,10,10,12,14,11,11,24,16,10 (a) Identify any outliers. Select the correct choice below and, if necessary, fill in the answer box to...
Find the five-number summary and the IQR and sketch the box plot for the sample represented...
Find the five-number summary and the IQR and sketch the box plot for the sample represented by the data frequency table x -5 -3 -2 -1 0 1 3 4 5 f 2 1 3 2 4 1 1 2 1
Using the following stem & leaf plot, find the five number summary for the data 110...
 Using the following stem & leaf plot, find the five number summary for the data 110 2 23 4 4 3]1 42 279 510 48 889 608 Min Med- 03- Max- Points possible: 1 This is attempt 1 of 3. Submit F8 F9 F10 F11 F1 F4 F5 F6 F7
Part Two: Create a box and whisker plot and identify the outliers for the following data...
Part Two: Create a box and whisker plot and identify the outliers for the following data sets 4 and 5 Data Set 4 12, 72, 10, 13, 9, 11, 13, 12, 8, 15. Data Set 5 88, 89, 87, 92, 15, 85, 95, 98, 100, 90.
Use the following data set to complete the questions below. Calculate the five number summary and...
 Use the following data set to complete the questions below. Calculate the five number summary and sketch a box and whisker plot. Be sure to label your box plot correctly. 78 74 76 80 85 81 62 80 91 46 20 94 95 96 91 82 (a) Calculate the five number summary. (b) Calculate the interquartile range and determine any potential outliers. (c) Sketch a boxplot. Be sure to label your boxplot correctly. (d) Write one inference you can make...
 Use the box and whisker plot to identify (a) the five-number summary, and (b) the interquartle range. 2134 12T 1438 1916 B00 1200 1500 1a00 10 (a) Min- Ma (b) 1QR-(simpity your answer) Enter yuur nnswar in each of the antwer boxeh neccrint.duFictriseR Tyue here to search Bad 3 U Y T R H D sehe lx ad whisker pat to aderty Ju) the fve sumber amy ( the rerquatle ca 134 217 1 7 CAM 6 la) Min May...
 3. Find five point summary and draw the box plot for the following data. Is the distribution skewed? On which side? (a) 4, 5, 2, 2, 4, 5, 3, 5, 6, 4 (b) 7.5, 5.5, 7.2, 2.8, 4.5, 3.7, 4.5,8.6,9.3, 6.6, 3.4.
 Solve the following based off the following data:
1) Find P37
2) Five Point Summary
3) Box and Whisker Plot
4) Is this data normal?
6) Given 1 Find P37 2) Five point summary 3) Box and whisker plot 4 Is this data normal? 6 Hrowwnn e Wap funt vt Noore
Solve the following based off the following data:
1) Find P37
2) Five Point Summary
3) Box and Whisker Plot
4) Is this data normal?
6) Given 1 Find P37 2) Five point summary 3) Box and whisker plot 4 Is this data normal? 6 Hrowwnn e Wap funt vt Noore
 Using the following stem & leaf plot, find the five number summary for the data 110 2 23 4 4 3]1 42 279 510 48 889 608 Min Med- 03- Max- Points possible: 1 This is attempt 1 of 3. Submit F8 F9 F10 F11 F1 F4 F5 F6 F7
 Use the following data set to complete the questions below. Calculate the five number summary and sketch a box and whisker plot. Be sure to label your box plot correctly. 78 74 76 80 85 81 62 80 91 46 20 94 95 96 91 82 (a) Calculate the five number summary. (b) Calculate the interquartile range and determine any potential outliers. (c) Sketch a boxplot. Be sure to label your boxplot correctly. (d) Write one inference you can make...
Most questions answered within 3 hours.
-
Calculate the number density of argon gas at a temperature of
24C and a pressure of...
asked 18 minutes ago -
Alternative
Classification
How to Estimate
Probabilities from Data? ( For continuous Attributes)
And How to generate...
asked 21 minutes ago -
An explosion breaks a 20.0-kg object into three parts. The
object is initially moving at a...
asked 1 hour ago -
Calculate the approximate number of residues of Rubisco, which
is involved in carbon fixation in plants,...
asked 2 hours ago -
Other decisions about scientific claims can have a much broader
impact.ENERGYarrow-10x10.png, environment, health, security - all...
asked 3 hours ago -
I need to write a research paper and work cited about this
topic: The United States...
asked 3 hours ago -
Hello! I was wondering if I could have some help?
If the vapor pressure of carvone...
asked 3 hours ago -
An economist wants to estimate the mean per capita income (in
thousands of dollars) for a...
asked 4 hours ago -
What would be the input/output characteristic of a circuit
obtained by putting two of your 2's-complementers...
asked 4 hours ago -
In Drosophila, the transition from the syncytial blastoderm
stage to the cellular blastoderm stage is a...
asked 4 hours ago -
Project management question:
Name 3 different types of resources (hint: humans are one
type)
asked 4 hours ago -
Consider the following reaction: C 2H 2( g) + 2H 2( g) C 2H 6(
g)...
asked 5 hours ago