The scores on a Statistics exam are normally distributed with a mean 75 with a standard...
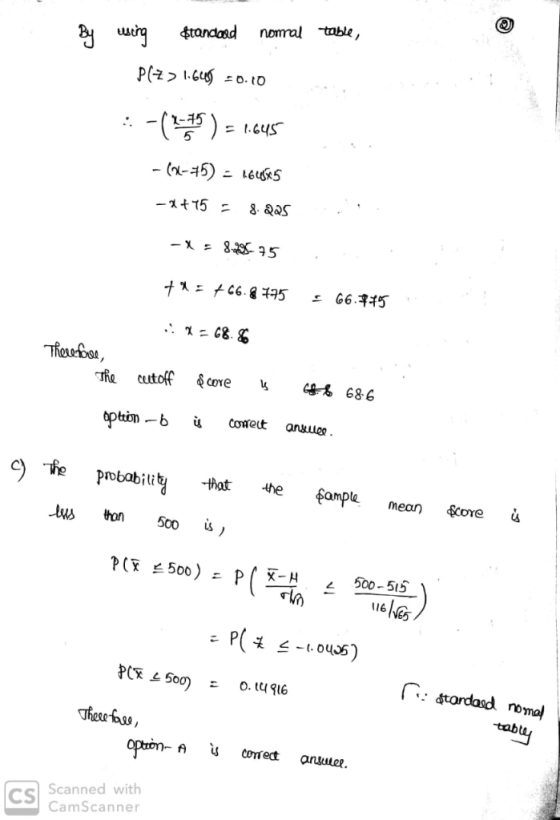
The scores on a Statistics exam are normally distributed with a mean 75 with a standard deviation of 5. If nine students are randomly selected what is the probability that their mean score is greater than 68. (a) .0808 (b) -.4000 (c) .9192 (d) .0001 (e) .9999 29. Refer to question 28. Suppose that students with the lowest 10% of scores are placed on academic probation, what is the cutoff score to avoid being placed on academic probation? (a) > 81.4 (b) > 68.6 (c) -.28 (d) -1.28 (e) .8997 The College Board reports that the in 2016, the mean mathematics SAT score was 515, and the standard deviation was 116. A sample of 65 scores is chosen from the population of all SAT scores. Find the probability that the sample mean score is less than 500. (a) .1492 (b).8508 (c) -.13 (d) .4483 (e) .5517 34. Refer to question 33. Find the probability that the sample mean score is between 480 and 520. (a) .1358 (b) .3475 (c) .6293 (d) .3707 (e).6923 35. Refer to question 33. Find the 80th percentile of the sample mean. (a) 613 (b) .8416 (c) 97.62 (d) 417 (e) 631 36. Refer to question 33. Would it be unusual if the sample mean were greater than 550? (a) No (b) Yes 37. Do you think it would be unusual for an individual to get a score greater than 550? (a) No (b) Yes 38. A value that is 2 standard deviations below the mean will have a z-score of: (a) 2.00 (b) .05 (c) .9500 (d) -2.00 (e) -1.50 SHOW WORK
Homework Answers


Add Answer to:
The scores on a Statistics exam are normally distributed with a
mean 75 with a standard...
8. Assume that SAT scores are normally distributed with mean 1518 and standard deviation 325. ROUND...
8. Assume that SAT scores are normally distributed with mean 1518 and standard deviation 325. ROUND YOUR ANSWERS TO 4 DECIMAL PLACES a. If 100 SAT scores are randomly selected, find the probability that they have a mean less than 1500.___________ b. If 64 SAT scores are randomly selected, find the probability that they have a mean greater than 1600 c. If 25 SAT scores are randomly selected, find the probability that they have a mean between 1550 and 1575...
SAT scores: Assume that in a given year the mean mathematics SAT score was 572, and...
 SAT scores: Assume that in a given year the mean mathematics SAT score was 572, and the standard deviation was 127. A sample of 72 scores is chosen. Use the TI-84 Plus calculator. Part 1 of 5 (a) What is the probability that the sample mean score is less than 5677 Round the answer to at least four decimal places. The probability that the sample mean score is less than 567 is Part 2 of 5 (b) What is the...
Suppose IQ scores are normally distributed with mean 100 and standard deviation 10. Which of the...
Suppose IQ scores are normally distributed with mean 100 and standard deviation 10. Which of the following is false? Group of answer choices A normal probability plot of IQ scores of a random sample of 1,000 people should show a straight line. Roughly 68% of people have IQ scores between 90 and 110. An IQ score of 80 is more unusual than an IQ score of 120. An IQ score greater than 130 is highly unlikely, but not impossible.
2. Given a test that is normally distributed with a mean of 100 and a standard...
 2. Given a test that is normally distributed with a mean of 100 and a standard deviation of 12, find: (a) the probability that a single score drawn at random will be greater than 110 (relevant section) (b) the probability that a sample of 25 scores will have a mean greater than 105 (relevant section) (c) the probability that a sample of 64 scores will have a mean greater than 105 (relevant section) (d) the probability that the mean of...
Suppose that scores on a statistics exam are normally distributed with a mean of 77 and...
Suppose that scores on a statistics exam are normally distributed with a mean of 77 and a standard deviation of 4. Find the probability of a student scoring less than 80 on the exam using the following steps. (a) What region of the normal distribution are you looking to find the area of? (to the left of a zscore, to the right of a z-score, between two z-scores, or to the left of one z-score and to the right of...
Assume the random variable x is normally distributed with mean u = 80 and standard deviation...
 Assume the random variable x is normally distributed with mean u = 80 and standard deviation c=5. Find the indicated probability. P(65<x< 73) P(65<x< 73)=0 (Round to four decimal places as needed.) X 5.2.17 Use the normal distribution of SAT critical reading scores for which the mean is 507 and the standard deviation is 122. Assume the vari (a) What percent of the SAT verbal scores are less than 550? (b) If 1000 SAT verbal scores are randomly selected, about...
Assume math scores on the SAT are normally distributed with a mean of 500 and a standard deviation of 100.
Assume math scores on the SAT are normally distributed with a mean of 500 and a standard deviation of 100. a. What is the probability that one randomly selected individual taking the sat will have a Math score of more than 530? b. What is the probability that one randomly selected individual taking the SAT will have a Math score between 450 and 600?c. Find the 60th percentile of these scores.
Suppose that the population of SAT scores is normally distributed with a mean of 1000 and...
Suppose that the population of SAT scores is normally distributed with a mean of 1000 and a standard deviation of 100. To determine the effect of a course to prepare for the SAT, a random sample of 25 students who have taken the course is selected. The sample mean SAT is 1050. Do these data provide sufficient evidence at the 1% significance level to infer that students who take the course perform better on the SAT on average? Assume that...
Assume that all SAT scores are normally distributed with a mean µ = 1518 and a...
Assume that all SAT scores are normally distributed with a mean µ = 1518 and a standard deviation σ = 325. If 100 SAT scores (n = 100) are randomly selected, find the probability that the scores will have an average less than 1500. TIP: Make the appropriate z-score conversion 1st, and then use Table A-2 (Table V) to find the answer. Assume that all SAT scores are normally distributed with a mean µ = 1518 and a standard deviation...
Assume that in a given year the mean mathematics SAT score was 467, and the standard...
Assume that in a given year the mean mathematics SAT score was 467, and the standard deviation was 105. A sample of 59 scores is chosen. Use the TI-84 Plus calculator. Part 1 of 5 (a) What is the probability that the sample mean score is less than 455? Round the answer to at least four decimal places. The probability that the sample mean score is less than 455 is . Part 2 of 5 (b) What is the probability...
 SAT scores: Assume that in a given year the mean mathematics SAT score was 572, and the standard deviation was 127. A sample of 72 scores is chosen. Use the TI-84 Plus calculator. Part 1 of 5 (a) What is the probability that the sample mean score is less than 5677 Round the answer to at least four decimal places. The probability that the sample mean score is less than 567 is Part 2 of 5 (b) What is the...
 2. Given a test that is normally distributed with a mean of 100 and a standard deviation of 12, find: (a) the probability that a single score drawn at random will be greater than 110 (relevant section) (b) the probability that a sample of 25 scores will have a mean greater than 105 (relevant section) (c) the probability that a sample of 64 scores will have a mean greater than 105 (relevant section) (d) the probability that the mean of...
 Assume the random variable x is normally distributed with mean u = 80 and standard deviation c=5. Find the indicated probability. P(65<x< 73) P(65<x< 73)=0 (Round to four decimal places as needed.) X 5.2.17 Use the normal distribution of SAT critical reading scores for which the mean is 507 and the standard deviation is 122. Assume the vari (a) What percent of the SAT verbal scores are less than 550? (b) If 1000 SAT verbal scores are randomly selected, about...
Most questions answered within 3 hours.
-
3. Gains from trade
Consider two neighbouring island countries called Euphoria and
Contente. They each have...
asked 12 minutes ago -
A business executive has the option to invest money in two
plans: Plan A guarantees that...
asked 2 hours ago -
Hello, can someone please help me answer this question?
How much heat is absorbed by a...
asked 2 hours ago -
. A marketing researcher conducted a survey of 25 shoppers
randomly selected at the local mall...
asked 2 hours ago -
Create an comprehensive response to the
following:
Antimicrobial agents work on a multitude of microbes (bacteria,...
asked 2 hours ago -
6.13 LAB: Step counter. Section 6.3.
A pedometer treats walking 2,000 steps as walking 1 mile....
asked 2 hours ago -
(14.2) A block of mass m = 10 kg riding on a frictionless
horizontal plane is...
asked 2 hours ago -
Use any search engine to search for articles about Starbucks
partnership with Tata Companies in India...
asked 2 hours ago -
Let’s say that for some reason Bank Excess Reserves suddenly
increase sharply. What effect would this...
asked 2 hours ago -
Given:
Curent Assets: $600,000
Total Assets: $2,600,000
Current Liabilities: $500,000
Total Liabilities: $1,700,000
What is the...
asked 3 hours ago -
1. What is a “Bankster”? What is insider trading? Why is it
illegal?
2. What is...
asked 2 hours ago -
A transverse wave on a cord is given by
D(x,t)=0.18sin(2.7x−61.0t), where Dand x are in m...
asked 3 hours ago