Need help with a question on Homework: Use the illustration and table in FE-3 (below) plus the following information:
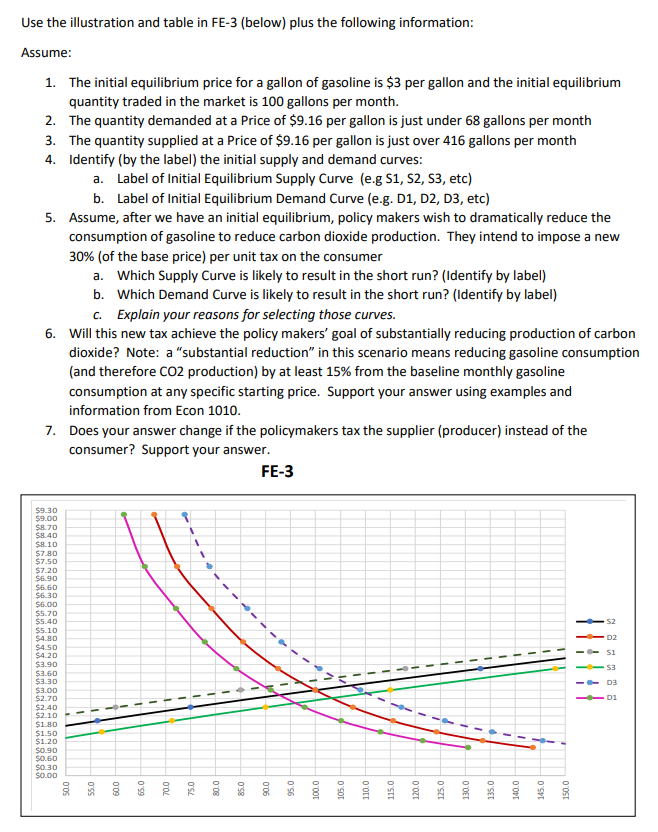
Assume: 1. The initial equilibrium price for a gallon of gasoline is $3 per gallon and the initial equilibrium quantity traded in the market is 100 gallons per month. 2. The quantity demanded at a Price of $9.16 per gallon is just under 68 gallons per month 3. The quantity supplied at a Price of $9.16 per gallon is just over 416 gallons per month 4. Identify (by the label) the initial supply and demand curves: a. Label of Initial Equilibrium Supply Curve (e.g S1, S2, S3, etc) b. Label of Initial Equilibrium Demand Curve (e.g. D1, D2, D3, etc) 5. Assume, after we have an initial equilibrium, policy makers wish to dramatically reduce the consumption of gasoline to reduce carbon dioxide production. They intend to impose a new 30% (of the base price) per unit tax on the consumer a. Which Supply Curve is likely to result in the short run? (Identify by label) b. Which Demand Curve is likely to result in the short run? (Identify by label) c. Explain your reasons for selecting those curves. 6. Will this new tax achieve the policy makers’ goal of substantially reducing production of carbon dioxide? Note: a “substantial reduction” in this scenario means reducing gasoline consumption (and therefore CO2 production) by at least 15% from the baseline monthly gasoline consumption at any specific starting price. Support your answer using examples and information from Econ 1010. 7. Does your answer change if the policymakers tax the supplier (producer) instead of the consumer? Support your answer.
![]() 042a321517344f068e73998f0acd017d.png
042a321517344f068e73998f0acd017d.png
Homework Answers
Request Answer!
We need at least 9 more requests to produce the answer.
1 / 10 have requested this problem solution
The more requests, the faster the answer.
Add Answer to:
Need help with a question on Homework: Use the illustration and table in FE-3 (below) plus the following information:
7. Problems and Applications Q7 Congress and the president decide that the United States should reduce...
 7. Problems and Applications Q7 Congress and the president decide that the United States should reduce air pollution by reducing its use of gasoline. They impose a $0.50 tax on each gallon of gasoline sold. Suppose they decided to impose the tax on producers. In the following graph, shows the effect of a $0.50 tax on each gallon of gasoline sold imposed on producers by shifting the demand or supply curve. Supply Demand Supply Price of Gasoline (Dollars per gallon)...
Click on the icon to read the news clip, then use this information to complete the...
 Click on the icon to read the news clip, then use this information to complete the following steps. In the left graph 1 Use the line tool to draw the market demand and supply curves in 2016. Label the curves. 2. The market equilibrium is 5 million gallons and the price is $50 a gallon Use the point tool to draw the market equilibrium and label it In the right graph Price (dollars per gallon) 30 85 Price and cost...
help pls 1 and 2 The table below contains data about the gasoline market If the...
 help pls 1 and 2
The table below contains data about the gasoline market If the price of a gallon of gasoline was Consumers would be willing to buy millions of gallons per day! Producers would be willing to sed millions of gallons per dayl: SO $2.75 $3.00 53.25 $3.50 SIIS Directions: Use the data above and the space below to graph the demand and succy curves for gasoline $3.50 $3.25 $3.00 $2.75 $2.50 $2.25 o 30 50 55 60...
help pls 1 and 2
The table below contains data about the gasoline market If the price of a gallon of gasoline was Consumers would be willing to buy millions of gallons per day! Producers would be willing to sed millions of gallons per dayl: SO $2.75 $3.00 53.25 $3.50 SIIS Directions: Use the data above and the space below to graph the demand and succy curves for gasoline $3.50 $3.25 $3.00 $2.75 $2.50 $2.25 o 30 50 55 60...
Suppose that the demand and supply curves for ethanol in the United States are represented by...
Suppose that the demand and supply curves for ethanol in the United States are represented by the following equations: QD = 1,600 − 320P QS = −800 + 640P where QD is the quantity demanded (in millions of gallons per month), QS is the quantity supplied, and P is the price (in dollars per gallon). In the scenario above, if the market is in equilibrium, the price of ethanol is $(blank) per gallon and the quantity of ethanol sold is...
Need help specifically on letter E. Thank you. 7. Given the following information about the demand...
 Need help specifically on letter E. Thank you.
7. Given the following information about the demand and supply for orange uice, answer the questions that follow: Quantity SuppliedDemanded PRICE 700 600 500 100 700 300 a. b. What is the equilibrium price and quantity in this market? Graph both the demand and supply curves and clearly identify this market equilibrium. c. Using your graph, clearly explain why P1 and P 5 are not the equilibrium prices. d. Suppose the demand...
Need help specifically on letter E. Thank you.
7. Given the following information about the demand and supply for orange uice, answer the questions that follow: Quantity SuppliedDemanded PRICE 700 600 500 100 700 300 a. b. What is the equilibrium price and quantity in this market? Graph both the demand and supply curves and clearly identify this market equilibrium. c. Using your graph, clearly explain why P1 and P 5 are not the equilibrium prices. d. Suppose the demand...
1-3 please Feel free to use any spaces for scratch work. 1) Consider the excise tax lectured in class. For a given e...
 1-3
please
Feel free to use any spaces for scratch work. 1) Consider the excise tax lectured in class. For a given excise tax, we can correctly predict that consumer tax incidence will be less than producer tax incidence when: a) Both the demand and the supply curves are more inelastic. b) The demand curve is inelastic and the supply curve is elastie. c) The demand curve is elastic and the supply curve is inelastic. d) Both the demand and...
1-3
please
Feel free to use any spaces for scratch work. 1) Consider the excise tax lectured in class. For a given excise tax, we can correctly predict that consumer tax incidence will be less than producer tax incidence when: a) Both the demand and the supply curves are more inelastic. b) The demand curve is inelastic and the supply curve is elastie. c) The demand curve is elastic and the supply curve is inelastic. d) Both the demand and...
Need help on b-e. for a I got quantity=13 and price=48. Thanks! 2) Consider the following...
 Need help on b-e. for a I got quantity=13 and price=48.
Thanks!
2) Consider the following supply and demand schedule for steel. Pa 100-4Qd P-9+3 a. Calculate the market equilibrium price and quantity for steel. (4pts) b. Pollution from steel production is estimated to create an external cost of $14 per ton. Show the demand and supply schedule graphically and identify the external cost curve, market equilibrium, deadweight loss, and social optimum quant ity. (4pts) c. Assume there is no...
Need help on b-e. for a I got quantity=13 and price=48.
Thanks!
2) Consider the following supply and demand schedule for steel. Pa 100-4Qd P-9+3 a. Calculate the market equilibrium price and quantity for steel. (4pts) b. Pollution from steel production is estimated to create an external cost of $14 per ton. Show the demand and supply schedule graphically and identify the external cost curve, market equilibrium, deadweight loss, and social optimum quant ity. (4pts) c. Assume there is no...
Price per Gallon Supply Demand 20 40 60 80 100 120 140 Blueberries (in gallons) The...
 Price per Gallon Supply Demand 20 40 60 80 100 120 140 Blueberries (in gallons) The government, hoping to encourage the consumption of the highly nutritious super food, is considering imposing a price ceiling at $5 per gallon of blueberries. Identify the equilibrium price and quantity of blueberries before the introduction of a price ceiling. Identify and quantify the effect of imposing a price ceiling at $5 per gallon on: 1) the quantity of blueberries that get bought and sold,...
1 Consumer surplus is defined as the: gap between the supply curve and the market price....
1 Consumer surplus is defined as the: gap between the supply curve and the market price. difference between a price ceiling and the market price. difference between a price floor and the market price. gap between the demand curve and the market price. 2. graph Mackenzie's demand for gasoline is shown in the graph provided. Part 1: The current price is $3.00 per gallon. Use the double drop line tool to indicate the current price and quantity combination. Label this...
Suppose a country is trying to limit gasoline consumption by setting a consumption quota that is...
Suppose a country is trying to limit gasoline consumption by setting a consumption quota that is less than the equilibrium consumption in the absence of the quota. Please use a supply and demand curve to illustrate the impacts of this quota policy on the following aspects: a. The equilibrium quantity and price with the quota b. Changes in consumer surplus and producer surplus c. Instead of a quota policy, what is the tax rate that will bri ng consumption/production to...
 7. Problems and Applications Q7 Congress and the president decide that the United States should reduce air pollution by reducing its use of gasoline. They impose a $0.50 tax on each gallon of gasoline sold. Suppose they decided to impose the tax on producers. In the following graph, shows the effect of a $0.50 tax on each gallon of gasoline sold imposed on producers by shifting the demand or supply curve. Supply Demand Supply Price of Gasoline (Dollars per gallon)...
 Click on the icon to read the news clip, then use this information to complete the following steps. In the left graph 1 Use the line tool to draw the market demand and supply curves in 2016. Label the curves. 2. The market equilibrium is 5 million gallons and the price is $50 a gallon Use the point tool to draw the market equilibrium and label it In the right graph Price (dollars per gallon) 30 85 Price and cost...
 help pls 1 and 2
The table below contains data about the gasoline market If the price of a gallon of gasoline was Consumers would be willing to buy millions of gallons per day! Producers would be willing to sed millions of gallons per dayl: SO $2.75 $3.00 53.25 $3.50 SIIS Directions: Use the data above and the space below to graph the demand and succy curves for gasoline $3.50 $3.25 $3.00 $2.75 $2.50 $2.25 o 30 50 55 60...
help pls 1 and 2
The table below contains data about the gasoline market If the price of a gallon of gasoline was Consumers would be willing to buy millions of gallons per day! Producers would be willing to sed millions of gallons per dayl: SO $2.75 $3.00 53.25 $3.50 SIIS Directions: Use the data above and the space below to graph the demand and succy curves for gasoline $3.50 $3.25 $3.00 $2.75 $2.50 $2.25 o 30 50 55 60...
 Need help specifically on letter E. Thank you.
7. Given the following information about the demand and supply for orange uice, answer the questions that follow: Quantity SuppliedDemanded PRICE 700 600 500 100 700 300 a. b. What is the equilibrium price and quantity in this market? Graph both the demand and supply curves and clearly identify this market equilibrium. c. Using your graph, clearly explain why P1 and P 5 are not the equilibrium prices. d. Suppose the demand...
Need help specifically on letter E. Thank you.
7. Given the following information about the demand and supply for orange uice, answer the questions that follow: Quantity SuppliedDemanded PRICE 700 600 500 100 700 300 a. b. What is the equilibrium price and quantity in this market? Graph both the demand and supply curves and clearly identify this market equilibrium. c. Using your graph, clearly explain why P1 and P 5 are not the equilibrium prices. d. Suppose the demand...
 1-3
please
Feel free to use any spaces for scratch work. 1) Consider the excise tax lectured in class. For a given excise tax, we can correctly predict that consumer tax incidence will be less than producer tax incidence when: a) Both the demand and the supply curves are more inelastic. b) The demand curve is inelastic and the supply curve is elastie. c) The demand curve is elastic and the supply curve is inelastic. d) Both the demand and...
1-3
please
Feel free to use any spaces for scratch work. 1) Consider the excise tax lectured in class. For a given excise tax, we can correctly predict that consumer tax incidence will be less than producer tax incidence when: a) Both the demand and the supply curves are more inelastic. b) The demand curve is inelastic and the supply curve is elastie. c) The demand curve is elastic and the supply curve is inelastic. d) Both the demand and...
 Need help on b-e. for a I got quantity=13 and price=48.
Thanks!
2) Consider the following supply and demand schedule for steel. Pa 100-4Qd P-9+3 a. Calculate the market equilibrium price and quantity for steel. (4pts) b. Pollution from steel production is estimated to create an external cost of $14 per ton. Show the demand and supply schedule graphically and identify the external cost curve, market equilibrium, deadweight loss, and social optimum quant ity. (4pts) c. Assume there is no...
Need help on b-e. for a I got quantity=13 and price=48.
Thanks!
2) Consider the following supply and demand schedule for steel. Pa 100-4Qd P-9+3 a. Calculate the market equilibrium price and quantity for steel. (4pts) b. Pollution from steel production is estimated to create an external cost of $14 per ton. Show the demand and supply schedule graphically and identify the external cost curve, market equilibrium, deadweight loss, and social optimum quant ity. (4pts) c. Assume there is no...
 Price per Gallon Supply Demand 20 40 60 80 100 120 140 Blueberries (in gallons) The government, hoping to encourage the consumption of the highly nutritious super food, is considering imposing a price ceiling at $5 per gallon of blueberries. Identify the equilibrium price and quantity of blueberries before the introduction of a price ceiling. Identify and quantify the effect of imposing a price ceiling at $5 per gallon on: 1) the quantity of blueberries that get bought and sold,...
Most questions answered within 3 hours.
-
An explosion breaks a 20.0-kg object into three parts. The
object is initially moving at a...
asked 25 minutes ago -
Calculate the approximate number of residues of Rubisco, which
is involved in carbon fixation in plants,...
asked 1 hour ago -
Other decisions about scientific claims can have a much broader
impact.ENERGYarrow-10x10.png, environment, health, security - all...
asked 2 hours ago -
I need to write a research paper and work cited about this
topic: The United States...
asked 2 hours ago -
Hello! I was wondering if I could have some help?
If the vapor pressure of carvone...
asked 3 hours ago -
An economist wants to estimate the mean per capita income (in
thousands of dollars) for a...
asked 3 hours ago -
What would be the input/output characteristic of a circuit
obtained by putting two of your 2's-complementers...
asked 3 hours ago -
In Drosophila, the transition from the syncytial blastoderm
stage to the cellular blastoderm stage is a...
asked 3 hours ago -
Project management question:
Name 3 different types of resources (hint: humans are one
type)
asked 4 hours ago -
Consider the following reaction: C 2H 2( g) + 2H 2( g) C 2H 6(
g)...
asked 4 hours ago -
Consider a 1.0 L buffer containing 0.092 mol L-1 HCOOH and 0.100
mol L-1 HCOO-. What...
asked 4 hours ago -
Koch Realty has owned a vacant land with a FMV of
$775,000 and an adjusted basis...
asked 4 hours ago