
Homework Answers
1.
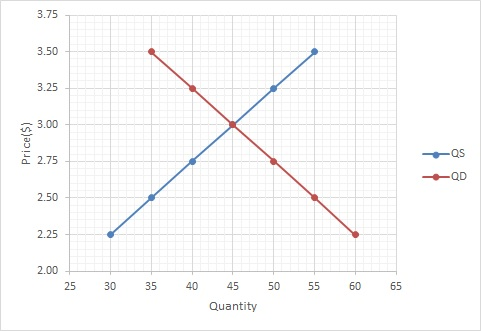
2. Answer to blank 1: 45
Answer to blank 2: $3.00
Explanation:
Equilibrium occurs where demand curve intersects the supply curve. It is seen from the graph that these two curves intersects at the price leve of $3.00 and quantity of 45 gallons.
Add Answer to:
help pls 1 and 2
The table below contains data about the gasoline market If the...
The local orange juice market in Arden-Arcade has demand and supply curves given by the following...
The local orange juice market in Arden-Arcade has demand and supply curves given by the following data. (All quantities are in thousands of gallons per week.) Price per gallon $1.75 $2.00 $2.25 $2.50 $2.75 $3.00 $3.25 Quantity demanded 10 9 8 7 6 5 4 Quantity supplied 0 4 8 12 16 20 24 What are the equilibrium price and quantity of orange juice? Group of answer choices $3.25 and 4 $2.25 and 8 $2.50 and 12 $1.75 and 10
Consider the market for gasoline, illustrated in the figure to the right. Suppose the government adds...
 Consider the market for gasoline, illustrated in the figure to
the right. Suppose the government adds a $1.50 per gallon excise
tax on gasoline, which shifts the supply curve from S1 to S2 , as
illustrated. What is tax incidence? Consumers pay $------- of the
tax and producers pay $------ of the tax. (Enter your responses
rounded to two decimal places.)
Question Help on 5.50 S2 5.00-1 4.50 4.00- G 3.50- 3.00 Price (dollars per gallon) 2.50 2.00 1.50 1.00...
Consider the market for gasoline, illustrated in the figure to
the right. Suppose the government adds a $1.50 per gallon excise
tax on gasoline, which shifts the supply curve from S1 to S2 , as
illustrated. What is tax incidence? Consumers pay $------- of the
tax and producers pay $------ of the tax. (Enter your responses
rounded to two decimal places.)
Question Help on 5.50 S2 5.00-1 4.50 4.00- G 3.50- 3.00 Price (dollars per gallon) 2.50 2.00 1.50 1.00...
8. In March 2002 the retail price of gasoline was S1.19 per gallon-exactly the same as...
 8. In March 2002 the retail price of gasoline was S1.19 per gallon-exactly the same as it was in August 1990. Yet total gasoline production and consumption rose from 6.6 million gallons per week in 1990 to 8.7 million gallons per week in 2002. Using the graph below, draw the appropriate shifts in the demand and supply curves to explain these two phenomena Price (S/gallon) S1990 D1990 Millions of gallons/week
The demand schedule given below is for the market for gasoline in a town. The marginal...
 The demand schedule given below is for the market for gasoline in a town. The marginal cost of supplying gasoline is constant at $2 per gallon. Assume that there are no fixed costs. part a: If the market is competitive what will be the price charged for a gallon of gasoline and what will be the gas stations economic profits? part b: If there is only one gas station in town what price will it charge and what will be...
You are given the following data on P and O for gasoline both before and affer the imposition of a per gallon tax...
 You are given the following data on P and O for gasoline both before and affer the imposition of a per gallon tax on producers in the local market for gasoline Q 40 gallons -35 gallons -$3/gallon $4/gallon Before the Tax After the Tax Part C: Using this elastioity value, fit the given data instead into a demand function of the constant elasticity form Using this elasticity value, the constant elasticity demand function would be OA QD 48.46 P-1 B....
Need help with this problem b-e, i did a already. Need help asap. Thanks Consider an agricultural subsidy provided by th...
 Need help with this problem
b-e, i did a already. Need help asap. Thanks
Consider an agricultural subsidy provided by the US government. Consider also that milk is one of the products subsidized. If there is NO trade with the rest of the world, the domestic price of milk in the US would be $2.25 per gallon and the equilibrium quantity would be 100 gallons at this price. After trade opens, at the world market price of $1.50 per gallon,...
Need help with this problem
b-e, i did a already. Need help asap. Thanks
Consider an agricultural subsidy provided by the US government. Consider also that milk is one of the products subsidized. If there is NO trade with the rest of the world, the domestic price of milk in the US would be $2.25 per gallon and the equilibrium quantity would be 100 gallons at this price. After trade opens, at the world market price of $1.50 per gallon,...
Q.2 (15 points) The following table shows the demand for gasoline by a public bus and...
 Q.2 (15 points) The following table shows the demand for gasoline by a public bus and the demand for gasoline by a private car. Price (per gallon) Demand for gasoline (per week) Quantity demanded by a Quantity demanded by a private public bus (gallons) car (gallons) S3.2 75 25 $3.0 80 40 $2.8 85 55 $2.6 90 70 95 85 $2.2 100 100 (a) Suppose the price of gasoline increases from $2.4 to $2.6. Calculate the price elasticity of demand...
Assume that the market demand and supply curves for milk are as shown in the graph...
 Assume that the market demand and supply curves for milk are as
shown
in the graph below.
As shown in the graph, the market clearing price is $3 per
gallon and the quantity
exchanged is 100 gallons per hour. Now assume that the
government imposes a tax of
2$ per gallon of milk produced.
a.
What is the total tax revenue the government will collect? Also,
shade
the area on your graph where the total tax revenue is
represented.
b....
Assume that the market demand and supply curves for milk are as
shown
in the graph below.
As shown in the graph, the market clearing price is $3 per
gallon and the quantity
exchanged is 100 gallons per hour. Now assume that the
government imposes a tax of
2$ per gallon of milk produced.
a.
What is the total tax revenue the government will collect? Also,
shade
the area on your graph where the total tax revenue is
represented.
b....
INTERNATIONAL TRADE WORKSHEET 2 Below, you are provided with the demand and supply curves for orange...
 INTERNATIONAL TRADE WORKSHEET 2 Below, you are provided with the demand and supply curves for orange juice. You will use this information to identify whether the country imports or exports orange juice. You will also determine whether producers and/or consumers win by engaging in international trade. $7 Price (per gallon) $6 Supply $5 $4 $3 $2 $1 Demand 30 60 210 90 120 150 180 Quantity of Orange Juice (in gallons) Part 1: Suppose that the country depicted above does...
Need help with a question on Homework: Use the illustration and table in FE-3 (below) plus the following information:
 Assume:
1. The initial equilibrium price for a gallon of gasoline is $3 per gallon and the initial equilibrium
quantity traded in the market is 100 gallons per month.
2. The quantity demanded at a Price of $9.16 per gallon is just under 68 gallons per month
3. The quantity supplied at a Price of $9.16 per gallon is just over 416 gallons per month
4. Identify (by the label) the initial supply and demand curves:
a. Label of Initial...
Assume:
1. The initial equilibrium price for a gallon of gasoline is $3 per gallon and the initial equilibrium
quantity traded in the market is 100 gallons per month.
2. The quantity demanded at a Price of $9.16 per gallon is just under 68 gallons per month
3. The quantity supplied at a Price of $9.16 per gallon is just over 416 gallons per month
4. Identify (by the label) the initial supply and demand curves:
a. Label of Initial...
 Consider the market for gasoline, illustrated in the figure to
the right. Suppose the government adds a $1.50 per gallon excise
tax on gasoline, which shifts the supply curve from S1 to S2 , as
illustrated. What is tax incidence? Consumers pay $------- of the
tax and producers pay $------ of the tax. (Enter your responses
rounded to two decimal places.)
Question Help on 5.50 S2 5.00-1 4.50 4.00- G 3.50- 3.00 Price (dollars per gallon) 2.50 2.00 1.50 1.00...
Consider the market for gasoline, illustrated in the figure to
the right. Suppose the government adds a $1.50 per gallon excise
tax on gasoline, which shifts the supply curve from S1 to S2 , as
illustrated. What is tax incidence? Consumers pay $------- of the
tax and producers pay $------ of the tax. (Enter your responses
rounded to two decimal places.)
Question Help on 5.50 S2 5.00-1 4.50 4.00- G 3.50- 3.00 Price (dollars per gallon) 2.50 2.00 1.50 1.00...
 8. In March 2002 the retail price of gasoline was S1.19 per gallon-exactly the same as it was in August 1990. Yet total gasoline production and consumption rose from 6.6 million gallons per week in 1990 to 8.7 million gallons per week in 2002. Using the graph below, draw the appropriate shifts in the demand and supply curves to explain these two phenomena Price (S/gallon) S1990 D1990 Millions of gallons/week
 The demand schedule given below is for the market for gasoline in a town. The marginal cost of supplying gasoline is constant at $2 per gallon. Assume that there are no fixed costs. part a: If the market is competitive what will be the price charged for a gallon of gasoline and what will be the gas stations economic profits? part b: If there is only one gas station in town what price will it charge and what will be...
 You are given the following data on P and O for gasoline both before and affer the imposition of a per gallon tax on producers in the local market for gasoline Q 40 gallons -35 gallons -$3/gallon $4/gallon Before the Tax After the Tax Part C: Using this elastioity value, fit the given data instead into a demand function of the constant elasticity form Using this elasticity value, the constant elasticity demand function would be OA QD 48.46 P-1 B....
 Need help with this problem
b-e, i did a already. Need help asap. Thanks
Consider an agricultural subsidy provided by the US government. Consider also that milk is one of the products subsidized. If there is NO trade with the rest of the world, the domestic price of milk in the US would be $2.25 per gallon and the equilibrium quantity would be 100 gallons at this price. After trade opens, at the world market price of $1.50 per gallon,...
Need help with this problem
b-e, i did a already. Need help asap. Thanks
Consider an agricultural subsidy provided by the US government. Consider also that milk is one of the products subsidized. If there is NO trade with the rest of the world, the domestic price of milk in the US would be $2.25 per gallon and the equilibrium quantity would be 100 gallons at this price. After trade opens, at the world market price of $1.50 per gallon,...
 Q.2 (15 points) The following table shows the demand for gasoline by a public bus and the demand for gasoline by a private car. Price (per gallon) Demand for gasoline (per week) Quantity demanded by a Quantity demanded by a private public bus (gallons) car (gallons) S3.2 75 25 $3.0 80 40 $2.8 85 55 $2.6 90 70 95 85 $2.2 100 100 (a) Suppose the price of gasoline increases from $2.4 to $2.6. Calculate the price elasticity of demand...
 Assume that the market demand and supply curves for milk are as
shown
in the graph below.
As shown in the graph, the market clearing price is $3 per
gallon and the quantity
exchanged is 100 gallons per hour. Now assume that the
government imposes a tax of
2$ per gallon of milk produced.
a.
What is the total tax revenue the government will collect? Also,
shade
the area on your graph where the total tax revenue is
represented.
b....
Assume that the market demand and supply curves for milk are as
shown
in the graph below.
As shown in the graph, the market clearing price is $3 per
gallon and the quantity
exchanged is 100 gallons per hour. Now assume that the
government imposes a tax of
2$ per gallon of milk produced.
a.
What is the total tax revenue the government will collect? Also,
shade
the area on your graph where the total tax revenue is
represented.
b....
 INTERNATIONAL TRADE WORKSHEET 2 Below, you are provided with the demand and supply curves for orange juice. You will use this information to identify whether the country imports or exports orange juice. You will also determine whether producers and/or consumers win by engaging in international trade. $7 Price (per gallon) $6 Supply $5 $4 $3 $2 $1 Demand 30 60 210 90 120 150 180 Quantity of Orange Juice (in gallons) Part 1: Suppose that the country depicted above does...
Most questions answered within 3 hours.
-
if total energy due two
electron is 1ev the distance between them is ?
asked 9 minutes ago -
You want to rent an unfurnished one-bedroom apartment in Boston
next year. The mean monthly rent...
asked 1 minute ago -
In regression analysis: a. the independent variable must be
categorical in nature. b. the variables being...
asked 2 minutes ago -
Hello
I really dont understand how to work this probelem. A viewed
solution of how it...
asked 19 seconds from now -
How do I write a C program called binary that takes a single
command line argument,...
asked 12 minutes ago -
Please help!!
Histidine is a polyprotic acid.
1. Draw a complete titration curve assuming 10.0 mL...
asked 11 minutes ago -
assume the salaries of elementary school teachers in the United
States normally distributed with a mean...
asked 15 minutes ago -
Question 10 - According to the Chapter Perspective, anti-hugging
policies have done which of the following?...
asked 17 minutes ago -
Research and explain how a hobby servo motor uses the pulse
width of the control signal...
asked 21 minutes ago -
To construct a solenoid, you wrap insulated wire uniformly
around a plastic tube 14 cm in...
asked 35 minutes ago -
Using traditional methods it takes 11.4 hours to receive a basic
driving license. A new license...
asked 40 minutes ago -
From the Principle of Conservation of Linear Moment, obtain the
Cauchy Movement equations in the Eulerian...
asked 53 minutes ago