Assume that the market demand and supply curves for milk are as shown
in the graph below.
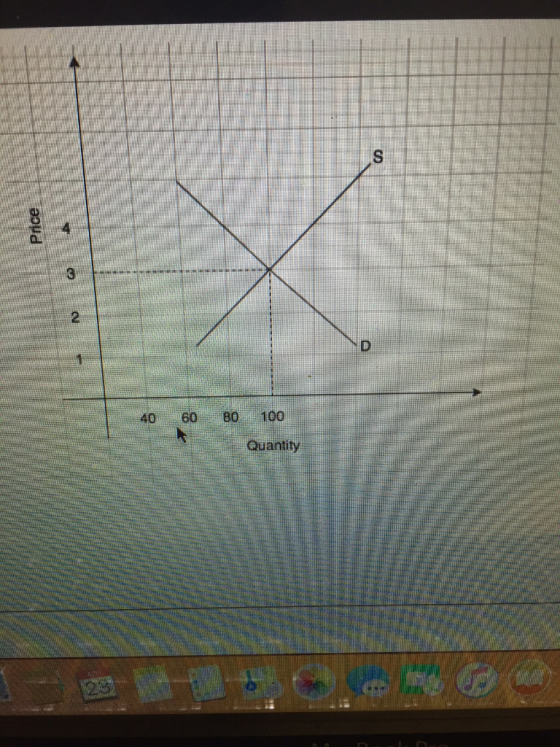
As shown in the graph, the market clearing price is $3 per gallon and the quantity
exchanged is 100 gallons per hour. Now assume that the government imposes a tax of
2$ per gallon of milk produced.
a.
What is the total tax revenue the government will collect? Also, shade
the area on your graph where the total tax revenue is represented.
b.
How much of this total will consumers pay?
c.
How much of this total will producers pay?
d.
Shade the area on your graph that shows the deadweight loss.
e.
If the demand for milk is perfectly inelastic, how would your analysis
change? Draw the graph and answer the above questions again.
Homework Answers
if a $2 tax is imposed on the market, the tax revenue collected will equal (4-2)*80 = 160
Consumers will pay $4, tax incidence will be $1 = 1*80 = 80 (Revenue from consumers)
and Producers will get $2 and tax incidence on them will be $1. = 1*80 = 80 (Revenue from Producers)
if the demand is perfectly inelastic then all of the tax incidence will be borne by the buyers.The buyers will pay whole $2 tax.

Add Answer to:
Assume that the market demand and supply curves for milk are as
shown
in the graph...
Consider the market for mountain bikes. The following graph shows the demand and supply for mountain...
 Consider the market for mountain bikes. The following graph shows the demand and supply for mountain bikes before the government imposes any taxes First, use the black point (plus symbol) to indicate the equilibrium price and quantity of mountain bikes in the absence of a tax. Then use the green point (triangle symbol) to shade the area representing total consumer surplus (CS) at the equilibrium price. Next, use the purple point (diamond symbol) to shade the area representing total producer...
Consider the market for mountain bikes. The following graph shows the demand and supply for mountain bikes before the government imposes any taxes.
 Consider the market for mountain bikes. The following graph shows the demand and supply for mountain bikes before the government imposes any taxes. First, use the black point (plus symbol) to indicate the equilibrium price and quantity of mountain bikes in the absence of a tax. Then use the green point (triangle symbol) to shade the area representing total consumer surplus (CS) at the equilibrium price. Next, use the purple point (diamond symbol) to shade the area representing total producer surplus...
Consider the market for designer purses. The following graph shows the demand and supply for designer purses before the government imposes any taxes.
 2. Taxes and welfare Consider the market for designer purses. The following graph shows the demand and supply for designer purses before the government imposes any taxes. First, use the black point (plus symbol) to indicate the equilibrium price and quantity of designer purses in the absence of a tax. Then use the green point (triangle symbol) to shade the area representing total consumer surplus (CS) at the equilibrium price. Next, use the purple point (diamond symbol) to shade the area representing...
Consider the market for commercial fans. The following graph shows the demand and supply for commercial fans before the government imposes any taxes.
 Consider the market for commercial fans. The following graph shows the demand and supply for commercial fans before the government imposes any taxes. First, use the black point (plus symbol) to indicate the equilibrium price and quantity of commercial fans in the absence of a tax. Then use the green point (triangle symbol) to shade the area representing total consumer surplus (CS) at the equilibrium price. Next, use the purple point (diamond symbol) to shade the area representing total producer surplus...
Refer to the market for tutoring services shown below. a. Mark on the graph and calculate...
 Refer to the market for tutoring services shown below.
a. Mark on the graph and calculate total consumer surplus in the
market, show work. b. Suppose the government imposes a $60 tax per
hour of tutoring income. How will this tax affect the market price
and quantity of hours sold? c. Mark and calculate the government
tax revenue from this $60 tax. Explain how much of this tax will be
paid by consumers and how much by producers. Mark the...
Refer to the market for tutoring services shown below.
a. Mark on the graph and calculate total consumer surplus in the
market, show work. b. Suppose the government imposes a $60 tax per
hour of tutoring income. How will this tax affect the market price
and quantity of hours sold? c. Mark and calculate the government
tax revenue from this $60 tax. Explain how much of this tax will be
paid by consumers and how much by producers. Mark the...
Consider the market for mountain bikes. The following graphshows the demand and supply for mountain...
 Consider the market for mountain bikes. The following graph
shows the demand and supply for mountain bikes before the
government imposes any taxes. First, use the black point (plus
symbol) to indicate the equilibrium price and quantity of mountain
bikes in the absence of a tax. Then use the green point (triangle
symbol) to shade the area representing total consumer surplus (CS)
at the equilibrium price. Next, use the purple point (diamond
symbol) to shade the area representing total producer...
Consider the market for mountain bikes. The following graph
shows the demand and supply for mountain bikes before the
government imposes any taxes. First, use the black point (plus
symbol) to indicate the equilibrium price and quantity of mountain
bikes in the absence of a tax. Then use the green point (triangle
symbol) to shade the area representing total consumer surplus (CS)
at the equilibrium price. Next, use the purple point (diamond
symbol) to shade the area representing total producer...
Consider the market for designer purses. The following graphshows the demand and supply for designer...
 Consider the market for designer purses. The following graph
shows the demand and supply for designer purses before the
government imposes any taxes.First, use the black point (plus symbol) to indicate the
equilibrium price and quantity of designer purses in the absence of
a tax. Then use the green point (triangle symbol) to shade the area
representing total consumer surplus (CS) at the equilibrium price.
Next, use the purple point (diamond symbol) to shade the area
representing total producer surplus...
Consider the market for designer purses. The following graph
shows the demand and supply for designer purses before the
government imposes any taxes.First, use the black point (plus symbol) to indicate the
equilibrium price and quantity of designer purses in the absence of
a tax. Then use the green point (triangle symbol) to shade the area
representing total consumer surplus (CS) at the equilibrium price.
Next, use the purple point (diamond symbol) to shade the area
representing total producer surplus...
Plus one more: Problem #10 The daily demand and supply curves for milk in Dairyville are...
 Plus one more: Problem #10 The daily demand and supply curves for milk in Dairyville are shown in the figure: Price ($ per gallon) Suppose the government imposes a price ceiling on milk of $5 per gallon. 200 400 600 800 1,000 1,200 Quantity (gallons per day) With the price ceiling: a. How many gallons of milk will be bought and sold each day? b. What will be the excess demand for milk each day? c. What will be consumer...
Consider the market for mountain bikes. The following graph shows the demand and supply for mountain bikes before the govemment imposes any taxes.
 2. Taxes and welfare Consider the market for mountain bikes. The following graph shows the demand and supply for mountain bikes before the govemment imposes any taxes. First, use the black point (plus symbol) to indicate the equilibrium price and quantity of mountain bikes in the absence of a tax. Then use the green point (triangle symbol) to shade the area representing total consumer surplus (CS) at the equilibrium price. Next, use the purple point (diamond symbol) to shade the area representing...
 Consider the market for mountain bikes. The following graph shows the demand and supply for mountain bikes before the government imposes any taxes First, use the black point (plus symbol) to indicate the equilibrium price and quantity of mountain bikes in the absence of a tax. Then use the green point (triangle symbol) to shade the area representing total consumer surplus (CS) at the equilibrium price. Next, use the purple point (diamond symbol) to shade the area representing total producer...
 Refer to the market for tutoring services shown below.
a. Mark on the graph and calculate total consumer surplus in the
market, show work. b. Suppose the government imposes a $60 tax per
hour of tutoring income. How will this tax affect the market price
and quantity of hours sold? c. Mark and calculate the government
tax revenue from this $60 tax. Explain how much of this tax will be
paid by consumers and how much by producers. Mark the...
Refer to the market for tutoring services shown below.
a. Mark on the graph and calculate total consumer surplus in the
market, show work. b. Suppose the government imposes a $60 tax per
hour of tutoring income. How will this tax affect the market price
and quantity of hours sold? c. Mark and calculate the government
tax revenue from this $60 tax. Explain how much of this tax will be
paid by consumers and how much by producers. Mark the...
 Consider the market for mountain bikes. The following graph
shows the demand and supply for mountain bikes before the
government imposes any taxes. First, use the black point (plus
symbol) to indicate the equilibrium price and quantity of mountain
bikes in the absence of a tax. Then use the green point (triangle
symbol) to shade the area representing total consumer surplus (CS)
at the equilibrium price. Next, use the purple point (diamond
symbol) to shade the area representing total producer...
Consider the market for mountain bikes. The following graph
shows the demand and supply for mountain bikes before the
government imposes any taxes. First, use the black point (plus
symbol) to indicate the equilibrium price and quantity of mountain
bikes in the absence of a tax. Then use the green point (triangle
symbol) to shade the area representing total consumer surplus (CS)
at the equilibrium price. Next, use the purple point (diamond
symbol) to shade the area representing total producer...
 Consider the market for designer purses. The following graph
shows the demand and supply for designer purses before the
government imposes any taxes.First, use the black point (plus symbol) to indicate the
equilibrium price and quantity of designer purses in the absence of
a tax. Then use the green point (triangle symbol) to shade the area
representing total consumer surplus (CS) at the equilibrium price.
Next, use the purple point (diamond symbol) to shade the area
representing total producer surplus...
Consider the market for designer purses. The following graph
shows the demand and supply for designer purses before the
government imposes any taxes.First, use the black point (plus symbol) to indicate the
equilibrium price and quantity of designer purses in the absence of
a tax. Then use the green point (triangle symbol) to shade the area
representing total consumer surplus (CS) at the equilibrium price.
Next, use the purple point (diamond symbol) to shade the area
representing total producer surplus...
 Plus one more: Problem #10 The daily demand and supply curves for milk in Dairyville are shown in the figure: Price ($ per gallon) Suppose the government imposes a price ceiling on milk of $5 per gallon. 200 400 600 800 1,000 1,200 Quantity (gallons per day) With the price ceiling: a. How many gallons of milk will be bought and sold each day? b. What will be the excess demand for milk each day? c. What will be consumer...
Most questions answered within 3 hours.
-
Tennis champion Maria Sharapova is capable of serving a tennis
ball at 126 mph.
b) What...
asked 1 minute ago -
The electric potential V in the space between the plates of a
given vacuum tube is...
asked 11 minutes ago -
The Hydroboration-Oxidation of an Alkene to Yield 1-Octanol.
1-octene to 1-octanol using BH3-THF
What might be...
asked 16 minutes ago -
You draw and keep a single bill from a hat that contains a
$11, $55, $20...
asked 33 minutes ago -
Write a Java program that has the following methods:
findSum - a method that takes in...
asked 34 minutes ago -
A coffee cup calorimeter initially contains 135g of water at
22.0oC. Calcium chloride (21.0g) at the...
asked 37 minutes ago -
A patient is having a magnetic resonance imaging scan (an MRI)
and has neglected to remove...
asked 39 minutes ago -
A student takes a multiple-choice test that has 10 questions.
Each question has two choices. The...
asked 1 hour ago -
Willie Keeler has a lifetime batting average of 0.341. Assume
that Willie Keeler came to bat...
asked 1 hour ago -
Which of the following has the highest boiling point?
A) 0.5m NaCl
B) 0.5m C6H12O6
C)...
asked 1 hour ago -
12. A firm is producing at an output level where
AR = MC > AC >...
asked 1 hour ago -
Radovilsky Manufacturing Company, in Hayward, California,
makes flashing lights for toys. The company operates its production...
asked 1 hour ago