help with this matlab problem asap thank you....
Homework Answers
%%
%a
t=-5:.01:4.99;
alpha=1;
s=.5*sin(alpha*t)./t;
figure
plot(t,s)
title(['Time scaling: s(t) for \alpha = ',num2str(alpha)])
figure
plot(t,abs(s))
title(['Time scaling: amplitude spectrum of s(t) for \alpha =
',num2str(alpha)])
alpha=2;
s=.5*sin(alpha*t)./t;
figure
plot(t,s)
title(['Time scaling: s(t) for \alpha = ',num2str(alpha)])
figure
plot(t,abs(s))
title(['Time scaling: amplitude spectrum of s(t) for \alpha =
',num2str(alpha)])
%%
%b
t=-5:.05:4.95;
s1=rectpuls(t);
s2=rectpuls(t-2.5);
figure
plot(t,s1,t,s2)
legend('s_1(t)','s_2(t)')
title('Time shifting: s_1(t) and s_2(t)')
figure
plot(t,abs(s1),t,abs(s2))
legend('s_1(t)','s_2(t)')
title('Time shifting: amplitude spectrum')
%%
%c
t=-5:.01:4.99;
s=sin(t)./t;
figure
plot(t,s)
title('Modulation Theorem: s(t)')
figure
plot(t,abs(s))
title('Modulation Theorem: amplitude spectrum of s(t)')
sm=s.*cos(2*pi*10*t);
figure
plot(t,sm)
title('Modulation Theorem: s_m(t)')
figure
plot(t,abs(sm))
title('Modulation Theorem: amplitude spectrum of s_m(t)')
Add Answer to:
help with this matlab problem asap thank you....
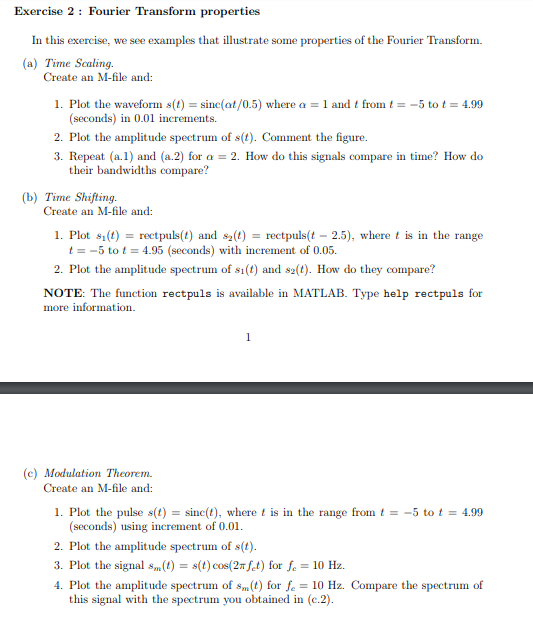
Exercise 2: Fourier Transform properties (a) Time Scaling....
Please finish these questions. Thank you Given find the Fourier transform of the following: (a) e dt 2T(2 1) 4 cos (2t) (Using properties of Fourier Transform to find) a) Suppose a signal m(t) is giv...
 Please finish these questions. Thank you
Given find the Fourier transform of the following: (a) e dt 2T(2 1) 4 cos (2t) (Using properties of Fourier Transform to find) a) Suppose a signal m(t) is given by m()-1+sin(2 fm) where fm-10 Hz. Sketch the signal m(t) in time domain b) Find the Fourier transform M(jo) of m(t) and sketch the magnitude of M(jo) c) If m(t) is amplitude modulated with a carrier signal by x(t)-m(t)cos(27r f,1) (where fe-1000 Hz), sketch...
Please finish these questions. Thank you
Given find the Fourier transform of the following: (a) e dt 2T(2 1) 4 cos (2t) (Using properties of Fourier Transform to find) a) Suppose a signal m(t) is given by m()-1+sin(2 fm) where fm-10 Hz. Sketch the signal m(t) in time domain b) Find the Fourier transform M(jo) of m(t) and sketch the magnitude of M(jo) c) If m(t) is amplitude modulated with a carrier signal by x(t)-m(t)cos(27r f,1) (where fe-1000 Hz), sketch...
This is taken from Section 4.6, "Amplitude Modulation and the Continuous-Time Fourier Transform," in the course...
 This is taken from Section 4.6, "Amplitude Modulation and the
Continuous-Time Fourier Transform," in the course text Computer
Explorations in signals and systems by Buck, Daniel, Singer, 2nd
Edition. I need the answers for the basic and intermediate
questions.
4.6 Amplitude Modulation and the Continuous-Time Fouriei Transform This exercise will explore amplitude modulation of Morse code messages. A simple ampli tude modulation system can be described by x(t) = m(t) cos(Crfot), (4.13) where m(t) is called the message waveform and...
This is taken from Section 4.6, "Amplitude Modulation and the
Continuous-Time Fourier Transform," in the course text Computer
Explorations in signals and systems by Buck, Daniel, Singer, 2nd
Edition. I need the answers for the basic and intermediate
questions.
4.6 Amplitude Modulation and the Continuous-Time Fouriei Transform This exercise will explore amplitude modulation of Morse code messages. A simple ampli tude modulation system can be described by x(t) = m(t) cos(Crfot), (4.13) where m(t) is called the message waveform and...
3) Given three sinusoids with the following amplitude and phases (t)-Scos(2x (1200+0.25x) a. Create a MATLAB...
 3) Given three sinusoids with the following amplitude and phases (t)-Scos(2x (1200+0.25x) a. Create a MATLAB program to sample each sinusoid and generate a sum of three sinusoids, that is, х(n)=x1(nHx:(n)+xy(n), using a sampling rate of 8000 Hz, and plot the sum x(n) over a range of time that will exhibit approximately 0.1 second. (10 pts) b. Use the MATLAB function fO to compute DFT coefficients, and plot and examine the spectrum of the signal x(n).(10 pts Write a MATLAB...
Problem 2 (Spectrum of a rectangular signal): In this problem, the amplitude spectrum of the signal 1 or Ot 2 ms x(t)- 0 otherwise is to be analysed (b) Numerical calculation of the spectrum: (i) Us...
 Problem 2 (Spectrum of a rectangular signal): In this problem, the amplitude spectrum of the signal 1 or Ot 2 ms x(t)- 0 otherwise is to be analysed (b) Numerical calculation of the spectrum: (i) Use Matlab to generate and plot a vector containing the sample values of the rectangular signal defined in (2) sampled at f 8kHz. Choose the number N of sample values so that it is a power of 2 and that the signal duration is at...
Please answer in MATLAB, thank you! 2. Calculate the energy of time domain signal x (t) and z (t) for the range of 0SIS...
 Please answer in MATLAB, thank you!
2. Calculate the energy of time domain signal x (t) and z (t) for the range of 0SIS2.5 Also calculate the energy of these signals in frequency domain using Parseval's theorem. Plot Energy (X) and Energy (Z) as a function of frequency f in a 2xl subplot (Energy vs frequency plot is know as energy spectrum of a signal).
2. Calculate the energy of time domain signal x (t) and z (t) for the...
Please answer in MATLAB, thank you!
2. Calculate the energy of time domain signal x (t) and z (t) for the range of 0SIS2.5 Also calculate the energy of these signals in frequency domain using Parseval's theorem. Plot Energy (X) and Energy (Z) as a function of frequency f in a 2xl subplot (Energy vs frequency plot is know as energy spectrum of a signal).
2. Calculate the energy of time domain signal x (t) and z (t) for the...
I need help with number 2 . Please answer in MATLAB thank you! 1. In the lab we analyzed filtering 60 Hz power-line noi...
 I need help with number 2 . Please answer in MATLAB thank
you!
1. In the lab we analyzed filtering 60 Hz power-line noise from ECG signal using a digital (signal processing) filter. Now let's try to an analog (circuit) filter approach to remove the 60 Hz line-noise. Following is an active twin-T notch filter with transfer function: (1+m)((2joRC? +1 Z(a) 2R 2R Here m is the ratio of the two feedback 2C R resistance which determines the gain and...
I need help with number 2 . Please answer in MATLAB thank
you!
1. In the lab we analyzed filtering 60 Hz power-line noise from ECG signal using a digital (signal processing) filter. Now let's try to an analog (circuit) filter approach to remove the 60 Hz line-noise. Following is an active twin-T notch filter with transfer function: (1+m)((2joRC? +1 Z(a) 2R 2R Here m is the ratio of the two feedback 2C R resistance which determines the gain and...
Program from problem 1: (Using MATLAB) % Sampling frequency and sampling period fs = 10000; ts...
 Program from problem 1: (Using MATLAB)
% Sampling frequency and sampling period
fs = 10000;
ts = 1/fs;
% Number of samples, assume 1000 samples
l = 1000;
t = 0:1:l-1;
t = t.*ts; % Convert the sample index into time for generation and
plotting of signal
% Frequency and amplitude of the sensor
f1 = 110;
a1 = 1.0;
% Frequency and amplitude of the power grid noise
f2 = 60;
a2 = 0.7;
% Generating the sinusoidal waves...
Program from problem 1: (Using MATLAB)
% Sampling frequency and sampling period
fs = 10000;
ts = 1/fs;
% Number of samples, assume 1000 samples
l = 1000;
t = 0:1:l-1;
t = t.*ts; % Convert the sample index into time for generation and
plotting of signal
% Frequency and amplitude of the sensor
f1 = 110;
a1 = 1.0;
% Frequency and amplitude of the power grid noise
f2 = 60;
a2 = 0.7;
% Generating the sinusoidal waves...
2. (14 points) This problem shows an example of using the Fourier transform to analyze communicat...
 2. (14 points) This problem shows an example of using the Fourier transform to analyze communication systems. The system in Figure 4, where (t)-f(t)+sin(wt) and has been proposed for amplitude modulation. f(t) + sin(o) Figure 4: System proposed for amplitude modulation. (a) (7 points) The spectrum of the input f(t) is shown in Figure 1, where 2mB o/100. Sketch and label the spectrum Y(w) of the signal y(t). Hint: You will need to use the frequency convolution property of the...
Help solve in MATLAB 1. Let m(t) be the 2-bit modulating signal and s(t) cos(at) be...
 Help solve in MATLAB
1. Let m(t) be the 2-bit modulating signal and s(t) cos(at) be carrier signal as shown in Figure 3. Plot these two signals in 2 separated figures using MATLAB with a, = 600Or rad/s and t = 0:7, :0.01 sec where fs = 10MHz be the sampling rate to satisfy Nyquist theorem. Use the zoom in tool of MATLAB to clearly look at the signal if necessary. You can use the MATLAB function below to produce...
Help solve in MATLAB
1. Let m(t) be the 2-bit modulating signal and s(t) cos(at) be carrier signal as shown in Figure 3. Plot these two signals in 2 separated figures using MATLAB with a, = 600Or rad/s and t = 0:7, :0.01 sec where fs = 10MHz be the sampling rate to satisfy Nyquist theorem. Use the zoom in tool of MATLAB to clearly look at the signal if necessary. You can use the MATLAB function below to produce...
Matlab help 1) Given the functions x1()= tu()-tuft-1) and X2(t)=10e-5,11(), do the following: 1. Plotx,(t) and x2(0) using MATLAB 2. Use MATLAB to find and plot x(0=x:@*.x2(t), where * denotes co...
 Matlab help
1) Given the functions x1()= tu()-tuft-1) and X2(t)=10e-5,11(), do the following: 1. Plotx,(t) and x2(0) using MATLAB 2. Use MATLAB to find and plot x(0=x:@*.x2(t), where * denotes convolution. 3. Find x(t)=x;()*X2(1) by hand using Laplace transforms. 4. Plot the result of part 3 in MATLAB and compare it to that found in part 2. 2) Given the transfer function shown below, do the following: 1. Find the system's impulse response and plot it using MATLAB 2. Repeat...
Matlab help
1) Given the functions x1()= tu()-tuft-1) and X2(t)=10e-5,11(), do the following: 1. Plotx,(t) and x2(0) using MATLAB 2. Use MATLAB to find and plot x(0=x:@*.x2(t), where * denotes convolution. 3. Find x(t)=x;()*X2(1) by hand using Laplace transforms. 4. Plot the result of part 3 in MATLAB and compare it to that found in part 2. 2) Given the transfer function shown below, do the following: 1. Find the system's impulse response and plot it using MATLAB 2. Repeat...
 Please finish these questions. Thank you
Given find the Fourier transform of the following: (a) e dt 2T(2 1) 4 cos (2t) (Using properties of Fourier Transform to find) a) Suppose a signal m(t) is given by m()-1+sin(2 fm) where fm-10 Hz. Sketch the signal m(t) in time domain b) Find the Fourier transform M(jo) of m(t) and sketch the magnitude of M(jo) c) If m(t) is amplitude modulated with a carrier signal by x(t)-m(t)cos(27r f,1) (where fe-1000 Hz), sketch...
Please finish these questions. Thank you
Given find the Fourier transform of the following: (a) e dt 2T(2 1) 4 cos (2t) (Using properties of Fourier Transform to find) a) Suppose a signal m(t) is given by m()-1+sin(2 fm) where fm-10 Hz. Sketch the signal m(t) in time domain b) Find the Fourier transform M(jo) of m(t) and sketch the magnitude of M(jo) c) If m(t) is amplitude modulated with a carrier signal by x(t)-m(t)cos(27r f,1) (where fe-1000 Hz), sketch...
 This is taken from Section 4.6, "Amplitude Modulation and the
Continuous-Time Fourier Transform," in the course text Computer
Explorations in signals and systems by Buck, Daniel, Singer, 2nd
Edition. I need the answers for the basic and intermediate
questions.
4.6 Amplitude Modulation and the Continuous-Time Fouriei Transform This exercise will explore amplitude modulation of Morse code messages. A simple ampli tude modulation system can be described by x(t) = m(t) cos(Crfot), (4.13) where m(t) is called the message waveform and...
This is taken from Section 4.6, "Amplitude Modulation and the
Continuous-Time Fourier Transform," in the course text Computer
Explorations in signals and systems by Buck, Daniel, Singer, 2nd
Edition. I need the answers for the basic and intermediate
questions.
4.6 Amplitude Modulation and the Continuous-Time Fouriei Transform This exercise will explore amplitude modulation of Morse code messages. A simple ampli tude modulation system can be described by x(t) = m(t) cos(Crfot), (4.13) where m(t) is called the message waveform and...
 3) Given three sinusoids with the following amplitude and phases (t)-Scos(2x (1200+0.25x) a. Create a MATLAB program to sample each sinusoid and generate a sum of three sinusoids, that is, х(n)=x1(nHx:(n)+xy(n), using a sampling rate of 8000 Hz, and plot the sum x(n) over a range of time that will exhibit approximately 0.1 second. (10 pts) b. Use the MATLAB function fO to compute DFT coefficients, and plot and examine the spectrum of the signal x(n).(10 pts Write a MATLAB...
 Problem 2 (Spectrum of a rectangular signal): In this problem, the amplitude spectrum of the signal 1 or Ot 2 ms x(t)- 0 otherwise is to be analysed (b) Numerical calculation of the spectrum: (i) Use Matlab to generate and plot a vector containing the sample values of the rectangular signal defined in (2) sampled at f 8kHz. Choose the number N of sample values so that it is a power of 2 and that the signal duration is at...
 Please answer in MATLAB, thank you!
2. Calculate the energy of time domain signal x (t) and z (t) for the range of 0SIS2.5 Also calculate the energy of these signals in frequency domain using Parseval's theorem. Plot Energy (X) and Energy (Z) as a function of frequency f in a 2xl subplot (Energy vs frequency plot is know as energy spectrum of a signal).
2. Calculate the energy of time domain signal x (t) and z (t) for the...
Please answer in MATLAB, thank you!
2. Calculate the energy of time domain signal x (t) and z (t) for the range of 0SIS2.5 Also calculate the energy of these signals in frequency domain using Parseval's theorem. Plot Energy (X) and Energy (Z) as a function of frequency f in a 2xl subplot (Energy vs frequency plot is know as energy spectrum of a signal).
2. Calculate the energy of time domain signal x (t) and z (t) for the...
 I need help with number 2 . Please answer in MATLAB thank
you!
1. In the lab we analyzed filtering 60 Hz power-line noise from ECG signal using a digital (signal processing) filter. Now let's try to an analog (circuit) filter approach to remove the 60 Hz line-noise. Following is an active twin-T notch filter with transfer function: (1+m)((2joRC? +1 Z(a) 2R 2R Here m is the ratio of the two feedback 2C R resistance which determines the gain and...
I need help with number 2 . Please answer in MATLAB thank
you!
1. In the lab we analyzed filtering 60 Hz power-line noise from ECG signal using a digital (signal processing) filter. Now let's try to an analog (circuit) filter approach to remove the 60 Hz line-noise. Following is an active twin-T notch filter with transfer function: (1+m)((2joRC? +1 Z(a) 2R 2R Here m is the ratio of the two feedback 2C R resistance which determines the gain and...
 Program from problem 1: (Using MATLAB)
% Sampling frequency and sampling period
fs = 10000;
ts = 1/fs;
% Number of samples, assume 1000 samples
l = 1000;
t = 0:1:l-1;
t = t.*ts; % Convert the sample index into time for generation and
plotting of signal
% Frequency and amplitude of the sensor
f1 = 110;
a1 = 1.0;
% Frequency and amplitude of the power grid noise
f2 = 60;
a2 = 0.7;
% Generating the sinusoidal waves...
Program from problem 1: (Using MATLAB)
% Sampling frequency and sampling period
fs = 10000;
ts = 1/fs;
% Number of samples, assume 1000 samples
l = 1000;
t = 0:1:l-1;
t = t.*ts; % Convert the sample index into time for generation and
plotting of signal
% Frequency and amplitude of the sensor
f1 = 110;
a1 = 1.0;
% Frequency and amplitude of the power grid noise
f2 = 60;
a2 = 0.7;
% Generating the sinusoidal waves...
 2. (14 points) This problem shows an example of using the Fourier transform to analyze communication systems. The system in Figure 4, where (t)-f(t)+sin(wt) and has been proposed for amplitude modulation. f(t) + sin(o) Figure 4: System proposed for amplitude modulation. (a) (7 points) The spectrum of the input f(t) is shown in Figure 1, where 2mB o/100. Sketch and label the spectrum Y(w) of the signal y(t). Hint: You will need to use the frequency convolution property of the...
 Help solve in MATLAB
1. Let m(t) be the 2-bit modulating signal and s(t) cos(at) be carrier signal as shown in Figure 3. Plot these two signals in 2 separated figures using MATLAB with a, = 600Or rad/s and t = 0:7, :0.01 sec where fs = 10MHz be the sampling rate to satisfy Nyquist theorem. Use the zoom in tool of MATLAB to clearly look at the signal if necessary. You can use the MATLAB function below to produce...
Help solve in MATLAB
1. Let m(t) be the 2-bit modulating signal and s(t) cos(at) be carrier signal as shown in Figure 3. Plot these two signals in 2 separated figures using MATLAB with a, = 600Or rad/s and t = 0:7, :0.01 sec where fs = 10MHz be the sampling rate to satisfy Nyquist theorem. Use the zoom in tool of MATLAB to clearly look at the signal if necessary. You can use the MATLAB function below to produce...
 Matlab help
1) Given the functions x1()= tu()-tuft-1) and X2(t)=10e-5,11(), do the following: 1. Plotx,(t) and x2(0) using MATLAB 2. Use MATLAB to find and plot x(0=x:@*.x2(t), where * denotes convolution. 3. Find x(t)=x;()*X2(1) by hand using Laplace transforms. 4. Plot the result of part 3 in MATLAB and compare it to that found in part 2. 2) Given the transfer function shown below, do the following: 1. Find the system's impulse response and plot it using MATLAB 2. Repeat...
Matlab help
1) Given the functions x1()= tu()-tuft-1) and X2(t)=10e-5,11(), do the following: 1. Plotx,(t) and x2(0) using MATLAB 2. Use MATLAB to find and plot x(0=x:@*.x2(t), where * denotes convolution. 3. Find x(t)=x;()*X2(1) by hand using Laplace transforms. 4. Plot the result of part 3 in MATLAB and compare it to that found in part 2. 2) Given the transfer function shown below, do the following: 1. Find the system's impulse response and plot it using MATLAB 2. Repeat...
Most questions answered within 3 hours.
-
A 48.53 mL volume of 1.00 M HCl was mixed with 47.70 mL of 2.00
M...
asked 1 minute from now -
Can anyone solve: "Simulation with Arena 6th Edition - Chapter 8
- Question 3E"
8-3 Change...
asked 6 seconds from now -
Neural cell types can be specified from ESCs with
retinoic acid, conditioned medium, co-cultures or by...
asked 2 minutes ago -
What are some issues related to crimes, victims &
victimization that should be addressed?
asked 6 minutes ago -
Water flowing uniformly in a rectangular open channel has
manning value of 0.017, bottom slope of...
asked 50 minutes ago -
Nature Conservancy's leader abruptly steps
down.
One morning in October 2007, Steven. J. McCormick the president...
asked 55 minutes ago -
I asked a question similar to this one, which was answered
perfectly. Another practice problem is...
asked 1 hour ago -
Rachel is studying cholesterol synthesis in mice. Some mice
had a mutation in their sterol regulatory...
asked 1 hour ago -
Railco sells to its customers on account with terms of 2% / 5
/net 15. Ronco...
asked 1 hour ago -
Refer to the following lease amortization schedule. The 10
payments are made annually starting with the...
asked 1 hour ago -
Explain how God fits into Aquinas' theory of happiness.
asked 1 hour ago -
1.1 With aid of diagrams and suitable examples discuss
the economic effects of price controls.
1.2...
asked 1 hour ago