
Homework Answers

Add Answer to:
Control Chart Question 1 Given the following sets of data, construct an appropriate control chart and...
Question pertains to the x-chart part Sample Mean Range 16 8 12 13 6 6 4...
 Question pertains to the
x-chart part
Sample Mean Range 16 8 12 13 6 6 4 15 10 10 11 10 16 13 14 0 14 17 11 12 IU 12 12 11 13 14 12 7 8 13 9 11 14 7 13 15 10 15 Subsequently, samples of size 5 were taken from the process every week for the next 10 weeks. The times were measured and the following results oblained: Sample Mean Range 16 9 17 12...
Question pertains to the
x-chart part
Sample Mean Range 16 8 12 13 6 6 4 15 10 10 11 10 16 13 14 0 14 17 11 12 IU 12 12 11 13 14 12 7 8 13 9 11 14 7 13 15 10 15 Subsequently, samples of size 5 were taken from the process every week for the next 10 weeks. The times were measured and the following results oblained: Sample Mean Range 16 9 17 12...
A paper mill uses a control chart to Data on Imperfections in Rolls of Paper monitor...
 A paper mill uses a control chart to Data on Imperfections in Rolls of Paper monitor the imperfection in finished Total Total Ils of paper. Production output is umber Number of Number Number of of Rolls Imper- Day Produced fections Day Produced fections inspected for twenty days, and the resulting data are shown here. Use these data to set up a control chart for 218 4 12 18 14 nonconformities per roll of paper. Does the process appear to be...
Part 3 [35 Marks 3- The number of nonconforming switches in samples of size 75 are...
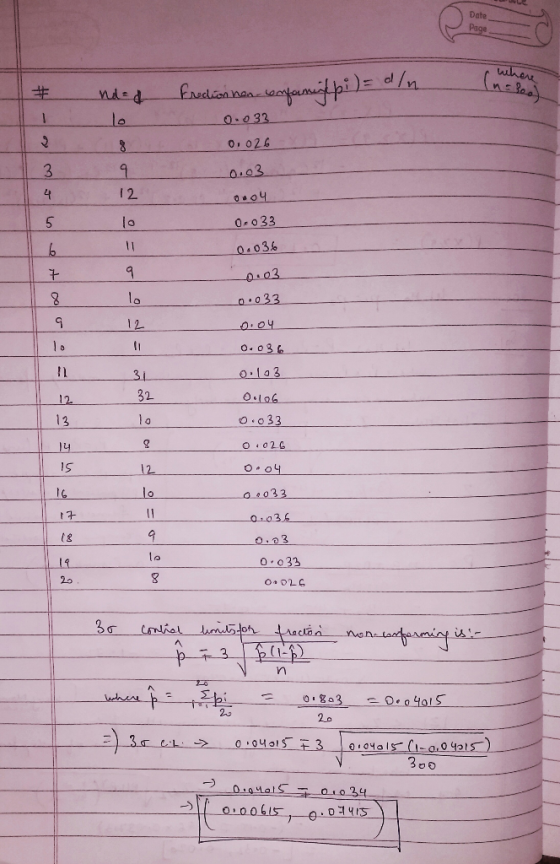
 Part 3 [35 Marks 3- The number of nonconforming switches in samples of size 75 are shown in Table 3. [20 Marks] Table 3 Number of Nonconforming Assemblies Number of Sample Nonconforming Number Sample Number Assemblies 6 7 11 1 15 12 2 0 13 1 3 9 14 3 4 5 15 6 5 1 16 8 4 17 10 7 5 18 5 7 19 2 9 12 20 7 10 (a) Construct a fraction nonconforming control chart...
Unit6: OPTIMIZING AND CONTROLLING PROCESSES THROUGH STATISTICAL PROCESS CONTROL 1. Define the concept of statistical process...
 Unit6: OPTIMIZING AND CONTROLLING PROCESSES THROUGH STATISTICAL
PROCESS CONTROL
1. Define the concept of statistical process control SPC?
2. What is SPC key element?
3. Solving the following problem (Using x -charts and R
–charts)?
a. Using this data to solve the problem by using X bar chart and
R chart?
b. What is the difference between X bar chart and R chart?
c. Draw the control chart for both X bar chart and R chart?
d. Explain the result?...
Unit6: OPTIMIZING AND CONTROLLING PROCESSES THROUGH STATISTICAL
PROCESS CONTROL
1. Define the concept of statistical process control SPC?
2. What is SPC key element?
3. Solving the following problem (Using x -charts and R
–charts)?
a. Using this data to solve the problem by using X bar chart and
R chart?
b. What is the difference between X bar chart and R chart?
c. Draw the control chart for both X bar chart and R chart?
d. Explain the result?...
2. The postmaster of a small western city receives a certain number of complaints each day about mail delivery. Construct a control chart with three sigma limits using the following data. Is the process in control? SAMPLE 1 2 3 4 5 6 7 8 9 10 11 12 13
1. The postmaster of a small western city receives a certain number of complaints each dayabout mail delivery. Construct a control chart with three sigma limits using the following data. Is the process in control? SAMPLE1234567891011121314Number of complaints4101489651213764210
can you please answer all question Attribute Control Charts Q1. The results of an inspection of...
 can
you please answer all question
Attribute Control Charts Q1. The results of an inspection of DNA samples taken over the past 10 days are given below. Sample size is 100. Day 1 2 3 4 5 6 7 8 9 Defectives 7 6 6 9 5 6 0 8 9 10 1 a) Construct a 3-sigma p-chart using this information. What are the 3 sigma control limits? b) Using the control chart in part (a), and finding that the...
can
you please answer all question
Attribute Control Charts Q1. The results of an inspection of DNA samples taken over the past 10 days are given below. Sample size is 100. Day 1 2 3 4 5 6 7 8 9 Defectives 7 6 6 9 5 6 0 8 9 10 1 a) Construct a 3-sigma p-chart using this information. What are the 3 sigma control limits? b) Using the control chart in part (a), and finding that the...
kon over the past 10 days are given below. Sample size is 100. Day Defectives 1...
 kon over the past 10 days are given below. Sample size is 100. Day Defectives 1 7 2 9 3 9 4 11 5 7 6 8 7 0 8 11 9 13 10 2 a) The upper and lower 3-sigma control chart limits are: UCL, -(enter your response as a number between 0 and 1, rounded to three decimal places). LCL - Center your response as a number between 0 and 1, rounded to three decimal plocos). b) Given...
Use the given process data to construct a control chart for p. If the weight of...
 Use the given process data to construct a control chart for p. If the weight of cereal in a particular packet is less than 14 ounces, the packet is considered nonconforming. Each week, the manufacturer randomly selects 1,000 cereal packets and determines the number that are nonconforming. The results for 12 consecutive weeks are shown below. 46 32 21 30 47 31 32 52 48 45 62 58 Select the correct lower control limit. LCL = 0.0230 LCL = 0.0000...
Please help me solve question 5. 5. A process that is considered to be in control measures an ingredient in ounces. Bel...
 Please help me solve question 5.
5. A process that is considered to be in control measures an ingredient in ounces. Below are the last 10 samples (each of size n = 5) taken. The population process standard deviation, , is 1.36 SAMPLES 10 7 4 3 2 1 10 8 13 10 7 12 10 13 7 10 12 10 7 10 10 10 9 12 10 11 11 10 12 10 12 10 11 11 10 12 8...
Please help me solve question 5.
5. A process that is considered to be in control measures an ingredient in ounces. Below are the last 10 samples (each of size n = 5) taken. The population process standard deviation, , is 1.36 SAMPLES 10 7 4 3 2 1 10 8 13 10 7 12 10 13 7 10 12 10 7 10 10 10 9 12 10 11 11 10 12 10 12 10 11 11 10 12 8...
2- The number of nonconforming switches in Number of Number of samples of size 150 are...
 2- The number of nonconforming switches in Number of Number of samples of size 150 are shown in the Table. Sample Construct a fraction nonconforming control chart (p-chart) for these data. Does the process appear to be in control? If not assume that assignable causes can be found 4 for all points outside the control limits and calculate the revised control limits. Nonconforming Switches Sample Number Nonconforniro Switches Number 12 13 14 15 16 17 18 19 0 15 10
 Question pertains to the
x-chart part
Sample Mean Range 16 8 12 13 6 6 4 15 10 10 11 10 16 13 14 0 14 17 11 12 IU 12 12 11 13 14 12 7 8 13 9 11 14 7 13 15 10 15 Subsequently, samples of size 5 were taken from the process every week for the next 10 weeks. The times were measured and the following results oblained: Sample Mean Range 16 9 17 12...
Question pertains to the
x-chart part
Sample Mean Range 16 8 12 13 6 6 4 15 10 10 11 10 16 13 14 0 14 17 11 12 IU 12 12 11 13 14 12 7 8 13 9 11 14 7 13 15 10 15 Subsequently, samples of size 5 were taken from the process every week for the next 10 weeks. The times were measured and the following results oblained: Sample Mean Range 16 9 17 12...
 A paper mill uses a control chart to Data on Imperfections in Rolls of Paper monitor the imperfection in finished Total Total Ils of paper. Production output is umber Number of Number Number of of Rolls Imper- Day Produced fections Day Produced fections inspected for twenty days, and the resulting data are shown here. Use these data to set up a control chart for 218 4 12 18 14 nonconformities per roll of paper. Does the process appear to be...
 Part 3 [35 Marks 3- The number of nonconforming switches in samples of size 75 are shown in Table 3. [20 Marks] Table 3 Number of Nonconforming Assemblies Number of Sample Nonconforming Number Sample Number Assemblies 6 7 11 1 15 12 2 0 13 1 3 9 14 3 4 5 15 6 5 1 16 8 4 17 10 7 5 18 5 7 19 2 9 12 20 7 10 (a) Construct a fraction nonconforming control chart...
 Unit6: OPTIMIZING AND CONTROLLING PROCESSES THROUGH STATISTICAL
PROCESS CONTROL
1. Define the concept of statistical process control SPC?
2. What is SPC key element?
3. Solving the following problem (Using x -charts and R
–charts)?
a. Using this data to solve the problem by using X bar chart and
R chart?
b. What is the difference between X bar chart and R chart?
c. Draw the control chart for both X bar chart and R chart?
d. Explain the result?...
Unit6: OPTIMIZING AND CONTROLLING PROCESSES THROUGH STATISTICAL
PROCESS CONTROL
1. Define the concept of statistical process control SPC?
2. What is SPC key element?
3. Solving the following problem (Using x -charts and R
–charts)?
a. Using this data to solve the problem by using X bar chart and
R chart?
b. What is the difference between X bar chart and R chart?
c. Draw the control chart for both X bar chart and R chart?
d. Explain the result?...
 can
you please answer all question
Attribute Control Charts Q1. The results of an inspection of DNA samples taken over the past 10 days are given below. Sample size is 100. Day 1 2 3 4 5 6 7 8 9 Defectives 7 6 6 9 5 6 0 8 9 10 1 a) Construct a 3-sigma p-chart using this information. What are the 3 sigma control limits? b) Using the control chart in part (a), and finding that the...
can
you please answer all question
Attribute Control Charts Q1. The results of an inspection of DNA samples taken over the past 10 days are given below. Sample size is 100. Day 1 2 3 4 5 6 7 8 9 Defectives 7 6 6 9 5 6 0 8 9 10 1 a) Construct a 3-sigma p-chart using this information. What are the 3 sigma control limits? b) Using the control chart in part (a), and finding that the...
 kon over the past 10 days are given below. Sample size is 100. Day Defectives 1 7 2 9 3 9 4 11 5 7 6 8 7 0 8 11 9 13 10 2 a) The upper and lower 3-sigma control chart limits are: UCL, -(enter your response as a number between 0 and 1, rounded to three decimal places). LCL - Center your response as a number between 0 and 1, rounded to three decimal plocos). b) Given...
 Use the given process data to construct a control chart for p. If the weight of cereal in a particular packet is less than 14 ounces, the packet is considered nonconforming. Each week, the manufacturer randomly selects 1,000 cereal packets and determines the number that are nonconforming. The results for 12 consecutive weeks are shown below. 46 32 21 30 47 31 32 52 48 45 62 58 Select the correct lower control limit. LCL = 0.0230 LCL = 0.0000...
 Please help me solve question 5.
5. A process that is considered to be in control measures an ingredient in ounces. Below are the last 10 samples (each of size n = 5) taken. The population process standard deviation, , is 1.36 SAMPLES 10 7 4 3 2 1 10 8 13 10 7 12 10 13 7 10 12 10 7 10 10 10 9 12 10 11 11 10 12 10 12 10 11 11 10 12 8...
Please help me solve question 5.
5. A process that is considered to be in control measures an ingredient in ounces. Below are the last 10 samples (each of size n = 5) taken. The population process standard deviation, , is 1.36 SAMPLES 10 7 4 3 2 1 10 8 13 10 7 12 10 13 7 10 12 10 7 10 10 10 9 12 10 11 11 10 12 10 12 10 11 11 10 12 8...
 2- The number of nonconforming switches in Number of Number of samples of size 150 are shown in the Table. Sample Construct a fraction nonconforming control chart (p-chart) for these data. Does the process appear to be in control? If not assume that assignable causes can be found 4 for all points outside the control limits and calculate the revised control limits. Nonconforming Switches Sample Number Nonconforniro Switches Number 12 13 14 15 16 17 18 19 0 15 10
Most questions answered within 3 hours.
-
Add 1ml of 0.18M of HCl (aq) to 1ml of 0.2M of [Ag(NH3)2]Br
(aq).
Write the...
asked 4 minutes ago -
1. Smoke detectors use Am-241, an alpha emitter, to detect smoke
particles. A parent is concerned...
asked 8 minutes ago -
Scenario: Web application developed to capture customers
demographic and financial information for filling their taxes. This...
asked 12 minutes ago -
Which of the following statements are true?
1. Glass is mostly silicon dioxide and so when...
asked 34 minutes ago -
Korman Company has the following securities in its portfolio of
equity securities on December 31, 2018:...
asked 34 minutes ago -
Using the 12th edition of Language Awareness,
complete the following assignment:
After reading Akiba Solomon's "Thugs....
asked 45 minutes ago -
For all problems assume an effective monthly interest rate of 1%
unless otherwise indicated in the...
asked 56 minutes ago -
Fix all syntax and logical errors for the following program.
Please generate the correct output. //...
asked 1 hour ago -
The USPS sells money orders identified by an 11 –digit number
x1, x2, …, x11. The...
asked 1 hour ago -
Provide an example of equilibrium in relation to
Newton’s First and Second Laws. Explain your answer....
asked 1 hour ago -
You are __________ to commit a Type I error using the 0.05 level
of significance than...
asked 1 hour ago -
1. the following results are obtained:
200
kiwi
575 wild-type
What can we conclude about the...
asked 1 hour ago