

Homework Answers
The statistical software output for this problem is:
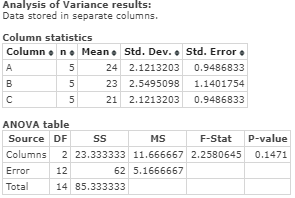
Hence,
f) Since p - value is greater than 0.05:
Do not reject Ho because p - value is not less than the significance level.
g) We cannot conclude that some means differ.
Add Answer to:
A random sample of five observations from three normally distributed populations produced the following data: (You...
A random sample of five observations from three normally distributed populations produced the following data: (You...
 A random sample of five observations from three normally distributed populations produced the following data: (You may find it useful to reference the F table.) Treatments 22 28 23 XA = 24.8 SA = 48.2 25 XR = 21.6 = 27.3 24 23 27 = 24.0 = 21.0 X d. Specify the competing hypotheses in order to determine whether some differences exist between the population means. OHO: MA - MB - MC; HA: Not all population means are equal. OHO:...
Consider the following competing hypotheses and accompanying sample data drawn independently from normally distributed populations. (You...
 Consider the following competing hypotheses and accompanying sample data drawn independently from normally distributed populations. (You may find it useful to reference the appropriate table: z table or t table) Ho: H1-Hu2 0 HA: H1 Hz< e 251 252 s1 39 s=19 n1=7 n 7 a-1. Calculate the value of the test statistic under the assumption that the population variances are equal. (Negative values should be indicated by a minus sign. Round all intermediate calculations to at least 4 decimal...
Consider the following competing hypotheses and accompanying sample data drawn independently from normally distributed populations. (You may find it useful to reference the appropriate table: z table or t table)
 Consider the following competing hypotheses and accompanying sample data drawn independently from normally distributed populations. (You may find it useful to reference the appropriate table: z table or t table) H0: μ1 − μ2 ≥ 0HA: μ1 − μ2 < 0 x¯1x¯1= 249x−2x−2= 262s1 = 35s2 = 23n1 = 10n2 = 10a-1. Calculate the value of the test statistic under the assumption that the population variances are equal. (Negative values should be indicated by a minus sign. Round all intermediate calculations to at least 4 decimal places and final answer to 3 decimal places.) a-2. Find the p-value. multiple choice 1p-value < 0.010.01 ≤ p-value...
Consider the following hypotheses: He: μ28e The population is normally distributed. A sample produces the following...
 Consider the following hypotheses: He: μ28e The population is normally distributed. A sample produces the following observations: 56 67 62 81 8366 Conduct the test at the 1% level of significance. (You may find lt useful to reference the appropriate table: table or Цеье o. Calculate the value of the test statistic. (Negative value should be Indicated by a minus sign. Round Intermedlate caleulatlons to at least 4 declmal places and final answer to 2 declmal places.) Test statistic b....
Consider the following hypotheses H0 : μ-420 HA: 420 The population is normally distributed with a...
 Consider the following hypotheses H0 : μ-420 HA: 420 The population is normally distributed with a population standard deviation of 72. (You may find it useful to reference the appropriate table: z table or t table) a-1. Calculate the value of the test statistic with x = 430 and n= 90' (Round intermediate calculations to at least 4 decimal places and final answer to 2 decimal places.) Test statistic a-2. what is the conclusion at the 1% significance level? OReject...
Consider the following hypotheses: H0: μ-360 The population is normally distributed with a population standard deviation...
 Consider the following hypotheses: H0: μ-360 The population is normally distributed with a population standard deviation of 73. (You may find it useful to reference the appropriate table: z table or t table) a-1. Calculate the value of the test statistic with x = 389 and n = 80, (Round intermediate calculations to at least 4 decimal places and final answer to 2 decimal places.) Test statistic a-2 what is the conclusion at the 10% significance level? Do not reject...
A random sample of five observations from three normally distributed populations produced the following data: (You...
A random sample of five observations from three normally distributed populations produced the following data: (You may find it useful to reference the F table.) Treatments A B C 23 30 30 31 29 18 15 23 15 22 23 27 25 31 15 x−A = 23.2 x−B = 27.2 x−C = 21.0 s2A = 33.2 s2B = 15.2 s2C = 49.5 Click here for the Excel Data File a. Calculate the grand mean. (Round intermediate calculations to at least...
n order to conduct a hypothesis test for the population proportion, you sample 480 observations that...
 n order to conduct a hypothesis test for the population proportion, you sample 480 observations that result in 264 successes. (You may find it useful to reference the appropriate table: z table or t table) Ho: pz 0.60 HA: p0.60 a-1. Calculate the value of the test statistic. (Negative value should be indicated by a minus sign. Round intermediate calculations to at least 4 decimal places and final answer to 2 decimal places.) Test statistic 2.24 a-2. Find the p-value....
In order to conduct a hypothesis test for the population mean, a random sample of 24...
 In order to conduct a hypothesis test for the population mean, a random sample of 24 observations is drawn from a normally distributed population. The resulting sample mean and sample standard deviation are calculated as 4.8 and 0.8, respectively. (You may find it useful to reference the appropriate table: z table or t table) H0 : μ s 4 , 5 against HA: μ > 4 . 5 a-1. Calculate the value of the test statistic. (Round all intermediate calculations...
In order to conduct a hypothesis test for the population proportion, you sample 300 observations that...
 In order to conduct a hypothesis test for the population proportion, you sample 300 observations that result in 111 successes. (You may find it useful to reference the appropriate table: z table or t table) HO : p o.41; HA p< 0.41. a-1. Calculate the value of the test statistic. (Negative value should be indicated by a minus sign. Round intermediate calculations to at least 4 decimal places and final answer to 2 decimal places.) Test statistic a-2. Find the...
 A random sample of five observations from three normally distributed populations produced the following data: (You may find it useful to reference the F table.) Treatments 22 28 23 XA = 24.8 SA = 48.2 25 XR = 21.6 = 27.3 24 23 27 = 24.0 = 21.0 X d. Specify the competing hypotheses in order to determine whether some differences exist between the population means. OHO: MA - MB - MC; HA: Not all population means are equal. OHO:...
 Consider the following competing hypotheses and accompanying sample data drawn independently from normally distributed populations. (You may find it useful to reference the appropriate table: z table or t table) Ho: H1-Hu2 0 HA: H1 Hz< e 251 252 s1 39 s=19 n1=7 n 7 a-1. Calculate the value of the test statistic under the assumption that the population variances are equal. (Negative values should be indicated by a minus sign. Round all intermediate calculations to at least 4 decimal...
 Consider the following hypotheses: He: μ28e The population is normally distributed. A sample produces the following observations: 56 67 62 81 8366 Conduct the test at the 1% level of significance. (You may find lt useful to reference the appropriate table: table or Цеье o. Calculate the value of the test statistic. (Negative value should be Indicated by a minus sign. Round Intermedlate caleulatlons to at least 4 declmal places and final answer to 2 declmal places.) Test statistic b....
 Consider the following hypotheses H0 : μ-420 HA: 420 The population is normally distributed with a population standard deviation of 72. (You may find it useful to reference the appropriate table: z table or t table) a-1. Calculate the value of the test statistic with x = 430 and n= 90' (Round intermediate calculations to at least 4 decimal places and final answer to 2 decimal places.) Test statistic a-2. what is the conclusion at the 1% significance level? OReject...
 Consider the following hypotheses: H0: μ-360 The population is normally distributed with a population standard deviation of 73. (You may find it useful to reference the appropriate table: z table or t table) a-1. Calculate the value of the test statistic with x = 389 and n = 80, (Round intermediate calculations to at least 4 decimal places and final answer to 2 decimal places.) Test statistic a-2 what is the conclusion at the 10% significance level? Do not reject...
 n order to conduct a hypothesis test for the population proportion, you sample 480 observations that result in 264 successes. (You may find it useful to reference the appropriate table: z table or t table) Ho: pz 0.60 HA: p0.60 a-1. Calculate the value of the test statistic. (Negative value should be indicated by a minus sign. Round intermediate calculations to at least 4 decimal places and final answer to 2 decimal places.) Test statistic 2.24 a-2. Find the p-value....
 In order to conduct a hypothesis test for the population mean, a random sample of 24 observations is drawn from a normally distributed population. The resulting sample mean and sample standard deviation are calculated as 4.8 and 0.8, respectively. (You may find it useful to reference the appropriate table: z table or t table) H0 : μ s 4 , 5 against HA: μ > 4 . 5 a-1. Calculate the value of the test statistic. (Round all intermediate calculations...
 In order to conduct a hypothesis test for the population proportion, you sample 300 observations that result in 111 successes. (You may find it useful to reference the appropriate table: z table or t table) HO : p o.41; HA p< 0.41. a-1. Calculate the value of the test statistic. (Negative value should be indicated by a minus sign. Round intermediate calculations to at least 4 decimal places and final answer to 2 decimal places.) Test statistic a-2. Find the...
Most questions answered within 3 hours.
-
Given the reaction where 1.00 mol H2(g) is burned in excess
O2(g) at 25 °C,
H2(g)...
asked 1 minute ago -
Suppose you wanted to make a buffer with pH 3.00. What chemicals
would you grab off...
asked 7 minutes ago -
Many celebrities and public figures have Twitter accounts with
large numbers of followers. However, some of...
asked 9 minutes ago -
Elemental phosphorus is produced by the reaction, 2Ca3(PO4)2
+6SiO2 +10C→6CaSiO3 +10CO+P4 Suppose that you have 7.00...
asked 8 minutes ago -
A nationwide survey found that 64% of people in the
Kingdom like Berger. If 3 people...
asked 21 minutes ago -
CYTOGENETIC MAPS VS LINKAGE MAPS
how do you read and extract information from cytogenetic and
linkage...
asked 22 minutes ago -
What volume of a 0.251 M perchloric
acid solution is required to neutralize
14.6 mL of...
asked 22 minutes ago -
Amplitude=3;
fs=8000;
n=0:399;
t=0:1/fs: n*1/fs-1/fs;
signal=3+3*cos(2*pi*1100*t)+3*cos(2*pi*2200*t)+3*cos(2*pi*3300*t);
fftSignal= fft(signal);
fftSignal=f ftshift (fftSignal);
f=fs/2*linspace(-1,1,fs);
plot(f,abs(fftsignal);
xlabel('Frequency(Hz)’)
yla
asked 23 minutes ago -
Write a method called removeDuplicates that
accepts a PriorityQueue of integers as a parameter
and modifies...
asked 25 minutes ago -
What is the wavelength, in cm, of a microwave having a frequency
of 3.44 x 10^9...
asked 43 minutes ago -
A new business venture must develop a comprehensive business
plan to borrow money to get started....
asked 45 minutes ago -
Madtack Company uses a job-order costing system and started the month
of March with only one...
asked 47 minutes ago