Is there a difference between the mean IQ scores for the oldest and youngest child in...
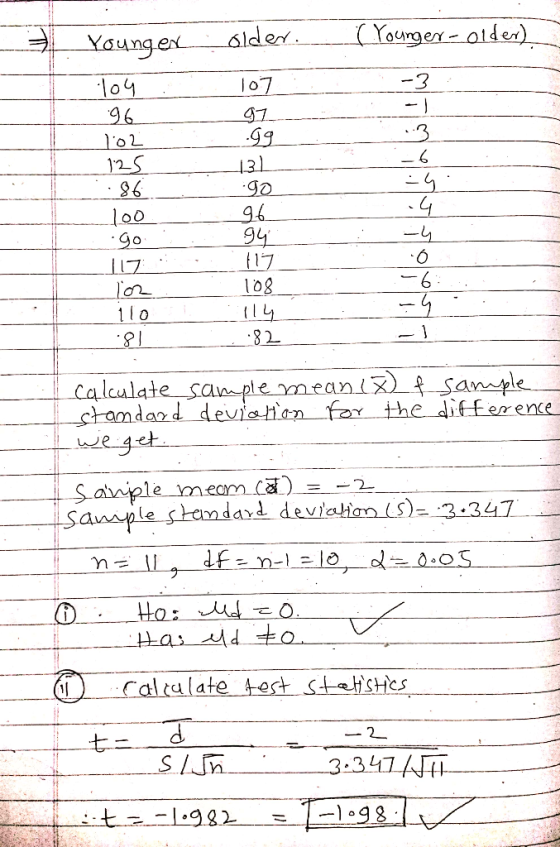
Is there a difference between the mean IQ scores for the oldest and youngest child in the family? Eleven sibling pairs were given IQ tests. The data is shown below.
| Younger | 104 | 96 | 102 | 125 | 86 | 100 | 90 | 117 | 102 | 110 | 81 |
| Older | 107 | 97 | 99 | 131 | 90 | 96 | 94 | 117 | 108 | 114 | 82 |
Assume the distribution of the differences is normal. What can be concluded at the 0.05 level of significance? (d = Younger Sibling IQ - Older Sibling IQ)
H0: d = 0 A. <
B. >
C. Not equal to
Test statistic: A. -2.43
B. -1.98
C. 1.01
D. 1.99
Critical value(s): A. 2.33
B. -2.23, 2.23
C. 1.645
D. -1.96, 1.96
p-Value (round answer to three decimal places): A. 0.142
B. 0.332
C. 0.076
D. 0.038
A. Fail to reject the null hypothesis
B. Reject the null hypothesis
A. Inusuficientt data
B. Sufficient data
Homework Answers

Add Answer to:
Is there a difference between the mean IQ scores for the oldest
and youngest child in...
Sibling IQ Scores (Raw Data, Software Required): There have been numerous studies involving the correlation and...
Sibling IQ Scores (Raw Data, Software Required): There have been numerous studies involving the correlation and differences in IQ's among siblings. Here we consider a small example of such a study. We will test the claim that, on average, older siblings have a higher IQ than their younger sibling. The results are depicted for a sample of 10 siblings in the table below. Test the claim at the 0.05 significance level. You may assume the sample of differences comes from...
Sibling IQ Scores: There have been numerous studies involving the correlation and differences in IQ's among...
Sibling IQ Scores: There have been numerous studies involving the correlation and differences in IQ's among siblings. Here we consider a small example of such a study. We will test the claim that, on average, older siblings have a higher IQ than their younger sibling. The results are depicted for a sample of 10 siblings in the table below. Test the claim at the 0.01 significance level. You may assume the sample of differences comes from a normally distributed population....
Sibling IQ Scores: There have been numerous studies involving the correlation and differences in IQ's among...
Sibling IQ Scores: There have been numerous studies involving the correlation and differences in IQ's among siblings. Here we consider a small example of such a study. We will test the claim that, on average, older siblings have a higher IQ than their younger sibling. The results are depicted for a sample of 10 siblings in the table below. Test the claim at the 0.05 significance level. You may assume the sample of differences comes from a normally distributed population....
On average is the younger sibling's IQ lower than the older sibling's IQ? Ten sibling pairs...
 On average is the younger sibling's IQ lower than the older sibling's IQ? Ten sibling pairs were given IQ tests. The data are shown below. IQ Scores Younger Sibling 106 85 91 113 91 110 96 96 87 116 Older Sibling 109 83 91 126 85 111 98 107 91 122 Assume a Normal distribution. What can be concluded at the the a= 0.10 level of significance? For this study, we should use Select an answer a. The null and...
Sibling IQ Scores: There have been numerous studies involving the correlation and differences in IQ's among...
Sibling IQ Scores: There have been numerous studies involving the correlation and differences in IQ's among siblings. Here we consider a small example of such a study. We will test the claim that, on average, older siblings have a higher IQ than their younger sibling. The results are depicted for a sample of 10siblings in the table below. Test the claim at the 0.01 significance level. You may assume the sample of differences comes from a normally distributed population. Pair...
Listed in the data table are IQ scores for a random sample of subjects with medium...
 Listed in the data table are IQ scores for a random sample of subjects with medium lead levels in their blood. Also listed are statistics from a study done of IQ scores for a random sample of subjects with high lead levels. Assume that the two samples are independent simple random samples selected from normally distributed populations. Do not assume that the population standard deviations are equal. Complete parts (a) and (b) below. Use a 0.05 significance level for both...
The following are the IQ scores of 60 students from a university. The histogram of the...
The following are the IQ scores of 60 students from a university. The histogram of the data is symmetric. 79 79 81 82 82 84 84 84 85 85 86 86 87 89 89 89 90 90 90 91 91 92 92 93 94 95 95 96 98 99 99 102 102 102 103 104 104 104 105 106 106 106 108 109 109 110 111 111 113 113 113 115 117 117 120 121 123 124 125 130 a....
A report included the following information on the heights (in.) for non-Hispanic white females Sample Sample...
 A report included the following information on the heights (in.) for non-Hispanic white females Sample Sample Std. Error Mean Mean Age Size 20-39 64.7 867 0.09 60 and older 934 63.1 0.11 (a) Calculate a confidence interval at confidence level approximately 95% for the difference between population mean height for the younger women and that for the older women. (Use n39-H0 and older) 2.01 Interpret the interval. OWe are 95% confident that the true average height of younger women is...
A report included the following information on the heights (in.) for non-Hispanic white females. Age Sample sample...
 A report included the following information on the heights (in.) for non-Hispanic white females. Age Sample sample sitd. Error Size Mean Mean 09 0 3.9 0.09 937 62.4 0.11 20-39 60 and older (a) Calculate a confidence interval at confidence level approximately 95% for the difference between population mean helight for the younger women and that for the older women. (Use 20-39" so and older Interpret the interval We cannot draw a conclusion from the given information. We are 95%...
A regort included the fallowing information an the heights (in.) for non-Hispanic white females. Sample Sample...
 A regort included the fallowing information an the heights (in.) for non-Hispanic white females. Sample Sample Std. Error Age Size Mean Mean 20-39 869 6 3,6 0,09 60 and older 938 61.8 0.11 (a) Calculate a confidence interval at confidence level approximately 95% for the difference between population mean height for the younger women and that for the older women. (Use #20-30-50 and older Interpret the interval. We are 95% confident that the true average height of younger women is...
 On average is the younger sibling's IQ lower than the older sibling's IQ? Ten sibling pairs were given IQ tests. The data are shown below. IQ Scores Younger Sibling 106 85 91 113 91 110 96 96 87 116 Older Sibling 109 83 91 126 85 111 98 107 91 122 Assume a Normal distribution. What can be concluded at the the a= 0.10 level of significance? For this study, we should use Select an answer a. The null and...
 Listed in the data table are IQ scores for a random sample of subjects with medium lead levels in their blood. Also listed are statistics from a study done of IQ scores for a random sample of subjects with high lead levels. Assume that the two samples are independent simple random samples selected from normally distributed populations. Do not assume that the population standard deviations are equal. Complete parts (a) and (b) below. Use a 0.05 significance level for both...
 A report included the following information on the heights (in.) for non-Hispanic white females Sample Sample Std. Error Mean Mean Age Size 20-39 64.7 867 0.09 60 and older 934 63.1 0.11 (a) Calculate a confidence interval at confidence level approximately 95% for the difference between population mean height for the younger women and that for the older women. (Use n39-H0 and older) 2.01 Interpret the interval. OWe are 95% confident that the true average height of younger women is...
 A report included the following information on the heights (in.) for non-Hispanic white females. Age Sample sample sitd. Error Size Mean Mean 09 0 3.9 0.09 937 62.4 0.11 20-39 60 and older (a) Calculate a confidence interval at confidence level approximately 95% for the difference between population mean helight for the younger women and that for the older women. (Use 20-39" so and older Interpret the interval We cannot draw a conclusion from the given information. We are 95%...
 A regort included the fallowing information an the heights (in.) for non-Hispanic white females. Sample Sample Std. Error Age Size Mean Mean 20-39 869 6 3,6 0,09 60 and older 938 61.8 0.11 (a) Calculate a confidence interval at confidence level approximately 95% for the difference between population mean height for the younger women and that for the older women. (Use #20-30-50 and older Interpret the interval. We are 95% confident that the true average height of younger women is...
Most questions answered within 3 hours.
-
in a perfectly elastic collision what is the velocity of ball A
if the original direction...
asked 15 minutes ago -
PLEASE ANSWER ALL
1) The pressure of the atmosphere decreases with increasing
altitude in the
Choose...
asked 29 minutes ago -
A simple random sample of 25,000 individuals are surveyed in
order to determine the prevalence of...
asked 31 minutes ago -
People who do very detailed work close up, such as jewelers,
often can see objects clearly...
asked 34 minutes ago -
14 years ago, Blue Lake Corp. issued 30 year to maturity
zero-coupon bonds with a par...
asked 25 minutes ago -
Warnerwoods Company uses a perpetual inventory system. It
entered into the following purchases and sales transactions...
asked 22 minutes ago -
Equivalent Units of Conversion Costs
The Rolling Department of Oak Ridge Steel Company had 6,842 tons...
asked 26 minutes ago -
what does the concept of "core competence" mean? why
is this concept important? How would you...
asked 29 minutes ago -
__________ is a type of visualization that is linked to strategy
and used within a formal...
asked 30 minutes ago -
A national magazine stated that at most,12% of millennials
have a pool membership. Formulate an appropriate...
asked 42 minutes ago -
Can
you provide the mechanism for enamine hydrolysis. Any example will
work, thank you.
asked 51 minutes ago -
Three of the compounds have ionic bonds (difference in
electronegativity is greater or equal to 2,...
asked 44 minutes ago