The following are the IQ scores of 60 students from a university. The histogram of the...
The following are the IQ scores of 60 students from a university. The histogram of the data is symmetric. 79 79 81 82 82 84 84 84 85 85 86 86 87 89 89 89 90 90 90 91 91 92 92 93 94 95 95 96 98 99 99 102 102 102 103 104 104 104 105 106 106 106 108 109 109 110 111 111 113 113 113 115 117 117 120 121 123 124 125 130
a. For this data, the 5-number statistics is (i) 79 89 99 109.5 130 (ii) 79 89.5 99 109 130 (iii) 79 89 99.5 110 130 (iv) none of the preceding
b. The mean and the standard deviation are (i) 99.82 and 13.23 (ii) 99.6 and 175.07 (iii) 99.82 and 13.12 (iv) none of the preceding
c. The z-score of the score 111 is (i) 0.8521 (ii) 0.8450 (iii) 0.8616 (iv) none of the preceding
d. If the z-score of a student is 0.6183, then the student’s IQ score is (i) 111 (ii) 108 (iii) 110 (iv) none of the preceding
e. The interval (¯ x−s, ¯ x+s) is approximately (i) [87, 113] (ii) [89, 115] (iii) [85, 111] (iv) none of the preceding
f. According to the empirical rule (i) about 68% of the scores fall in ¯ x±s, but the actual percentage of scores in the interval is 65. (ii) about 95% of the scores fall in ¯ x±s, but the actual percentage of scores in the interval is 65, which is much smaller than 95. (iii) about 50% of the scores fall in ¯ x±s, but the actual percentage of scores in the interval is 49, which is close to 50. (iv) about 16% of the scores are greater ¯ x+s, but the actual percentage of scores greater than ¯ x+s is 12.
Homework Answers
The 60 students summary are
79 79 81 82 82 84 84 84 85 85 86 86 87 89 89 89 90 90 90 91 91 92 92 93 94 95 95 96 98 99 99 102 102 102 103 104 104 104 105 106 106 106 108 109 109 110 111 111 113 113 113 115 117 117 120 121 123 124 125 130
a) The five point summary are
(i) 79 89 99 109.5 130
b) Mean calculated as

and standard deviation calculated as
sample standard deviation as
is standard deviaton is considered
(iii) 99.82 and 13.12
if Sample standrd devition is considered
(i) 99.82 and 13.23
c). The Z score for 111 calculated as if standard deviation
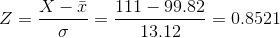
(i) 0.8521
if sample standard deviation considered

(ii) 0.8450
d).et the Z score =0.6183 hence IQ score as
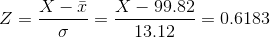
hence X,, (ii) 108
e) According to interval (¯ x−s, ¯ x+s) the value is approximately
(i) [87, 113]
f) According to the empirical rule (i) about 68% of the scores fall in ¯ x±s, but the actual percentage of scores in the interval is 65.
Add Answer to:
The following are the IQ scores of 60 students from a
university. The histogram of the...
USE R AND SHOW CODES!! The IQ was measured for 35 twins. Is there any difference...
USE R AND SHOW CODES!! The IQ was measured for 35 twins. Is there any difference in IQ between twins? DATA Twin 1 Twin 2 113 109 94 100 99 86 77 80 81 95 91 106 111 117 104 107 85 85 66 84 111 125 51 66 109 108 122 121 97 98 82 94 100 88 100 104 93 84 99 95 109 98 95 100 75 86 104 103 73 78 88 99 92 111 108...
Question 1 (30 marks) The scores of 60 students in a test are: 58 49 48...
Question 1 (30 marks) The scores of 60 students in a test are: 58 49 48 62 50 76 61 82 60 72 70 35 61 55 82 66 50 47 36 58 84 55 68 32 62 58 48 75 80 49 55 67 71 46 40 57 69 70 52 60 48 53 42 68 54 60 63 70 72 68 42 55 36 70 36 82 66 46 59 50 (i) Find the mean score of the...
1. For each set below, using Excel, construct a. a frequency distribution, ...
1. For each set below, using Excel, construct a. a frequency distribution, b. a relative frequency distribution, and c. a cumulative relative frequency distribution. Consider whether or not you should group your data. Describe how you determined your bin width, if you grouped the data in intervals. Set 1 75 95 103 100 93 91 90 92 89 105 86 85 81 96 103 99 94 95 91 97 92 107...
ASAP HELP!! A test was given to 50 fourth grade students The scores for the students...
 ASAP HELP!!
A test was given to 50 fourth grade students The scores for the students are given below. 93 108 91 116 92 87 100 88 109 110 91 119 88 100 86 119 113 85 103 118 100 112 87 95 95 94 114 87 119 96 113 100 112 100 107 93 91 95 111 108 110 88 117 101 88 97 118 87 114 103 (a) Construct a grouped frequency distribution for the data. Use 85-89...
ASAP HELP!!
A test was given to 50 fourth grade students The scores for the students are given below. 93 108 91 116 92 87 100 88 109 110 91 119 88 100 86 119 113 85 103 118 100 112 87 95 95 94 114 87 119 96 113 100 112 100 107 93 91 95 111 108 110 88 117 101 88 97 118 87 114 103 (a) Construct a grouped frequency distribution for the data. Use 85-89...
Here are the IQ test scores of 31 seventh-grade girls in a Midwest school district: 114...
Here are the IQ test scores of 31 seventh-grade girls in a Midwest school district: 114 100 104 89 102 91 114 114 103 105 108 130 120 132 111 128 118 119 86 72 111 103 74 112 107 103 98 96 112 112 93 These 31 girls are an SRS of all seventh-grade girls in the school district. Suppose that the standard deviation of IQ scores in this population is known to be σ σ = 15. We...
Ten randomly selected people took an IQ test A, and next day they took a very...
Ten randomly selected people took an IQ test A, and next day they took a very similar IQ test B. Their scores are shown in the table below. Person A B C D E F G H I J Test A 93 83 113 102 108 73 106 92 100 128 Test B 93 84 109 105 111 71 109 89 101 129 1. Consider (Test A - Test B). Use a 0.05 significance level to test the claim that...
Ten randomly selected people took an IQ test A, and next day they took a very...
Ten randomly selected people took an IQ test A, and next day they took a very similar IQ test B. Their scores are shown in the table below. Person A B C D E F G H I J Test A 104 98 89 117 107 120 80 109 94 85 Test B 102 99 88 117 111 119 83 107 95 88 1. Use a 0.05 significance level to test the claim that people do better on the second test...
Here are the IQ test scores of 31 seventh-grade girls in a Midwest school district: 114 100 104 89 102 91 114 114 103...
Here are the IQ test scores of 31 seventh-grade girls in a Midwest school district: 114 100 104 89 102 91 114 114 103 105 108 130 120 132 111 128 118 119 86 72 111 103 74 112 107 103 98 96 112 112 93 These 31 girls are an SRS of all seventh-grade girls in the school district. Suppose that the standard deviation of IQ scores in this population is known to be σ = 15. We expect...
The data from data349.dat contains information on 78 seventh-grade students. We want to know how well each of IQ score a...
The data from data349.dat contains information on 78 seventh-grade students. We want to know how well each of IQ score and self-concept score predicts GPA using least-squares regression. We also want to know which of these explanatory variables predicts GPA better. Give numerical measures that answer these questions. (Round your answers to three decimal places.) (Regressor: IQ) R 2 (Regressor: Self-Concept) R 2 Which variable is the better predictor? IQ Self Concept obs gpa iq gender concept 1 7.94 112 ...
I need answer on number 7 please 5. Students in a statistics class took their first...
I need answer on number 7 please 5. Students in a statistics class took their first test. The following table lists the scores they earned. 67 67 76 47 85 70 87 76 67 72 84 98 84 64 65 82 81 81 88 74 87 83 Complete the following frequency distribution table using 6 classes: 40-49, 50-59, 60-69, 70-79, 80-89, and 90-99. Scores Tally Frequency Relative Frequency Cumulative Relative Frequency 40 - 49 50 - 59 60 - 69...
 ASAP HELP!!
A test was given to 50 fourth grade students The scores for the students are given below. 93 108 91 116 92 87 100 88 109 110 91 119 88 100 86 119 113 85 103 118 100 112 87 95 95 94 114 87 119 96 113 100 112 100 107 93 91 95 111 108 110 88 117 101 88 97 118 87 114 103 (a) Construct a grouped frequency distribution for the data. Use 85-89...
ASAP HELP!!
A test was given to 50 fourth grade students The scores for the students are given below. 93 108 91 116 92 87 100 88 109 110 91 119 88 100 86 119 113 85 103 118 100 112 87 95 95 94 114 87 119 96 113 100 112 100 107 93 91 95 111 108 110 88 117 101 88 97 118 87 114 103 (a) Construct a grouped frequency distribution for the data. Use 85-89...
Most questions answered within 3 hours.
-
A concave spherical mirror has a radius of curvature of
magnitude 19.6 cm.
(a) Find the...
asked 6 minutes ago -
Calculate the equillibrium constent K for a redox reaction that
has E°cell = -.98 V at...
asked 5 minutes ago -
3. draw a diagram of the magnetic field:
a. around a long straight wire with a...
asked 5 minutes ago -
If you titrated 30.0 mL of 0.1 M HCl with 0.1 M NaOH, indicate
the approximate...
asked 13 minutes ago -
NADH passes electrons into the electron transport chain. List
the carriers that would receive the electrons,...
asked 22 minutes ago -
A cylindrical cable with a resistivity of 1.6x10⁻⁸ Ω·m and cross
sectional area of 3x10⁻⁵ m^2...
asked 22 minutes ago -
True or False.
A consumer with convex preferences who is indifferent between
the bundles (5,2) and...
asked 25 minutes ago -
A diamond's index of refraction for red light, 656 nm, is 2.410,
while that for blue...
asked 38 minutes ago -
Compare HPLC, SPE, and GC. Identify the differences, the
advantages, and the weaknesses of each method.
asked 39 minutes ago -
Characteristic x-rays emitted by potassium have a wavelength of
0.374 nm. What is the energy of...
asked 42 minutes ago -
there is a function to create two random numbers between 1 and
25 and a function...
asked 1 hour ago -
At a certain temperature, the ?pKp for the decomposition of
H2SH2S is 0.832.0.832.
H2S(g)↽−−⇀H2(g)+S(g)H2S(g)↽−−⇀H2(g)+S(g)
Initially, only...
asked 54 minutes ago