1. The supply and demand for saffron (a spice) are described by the following equations: Supply:...
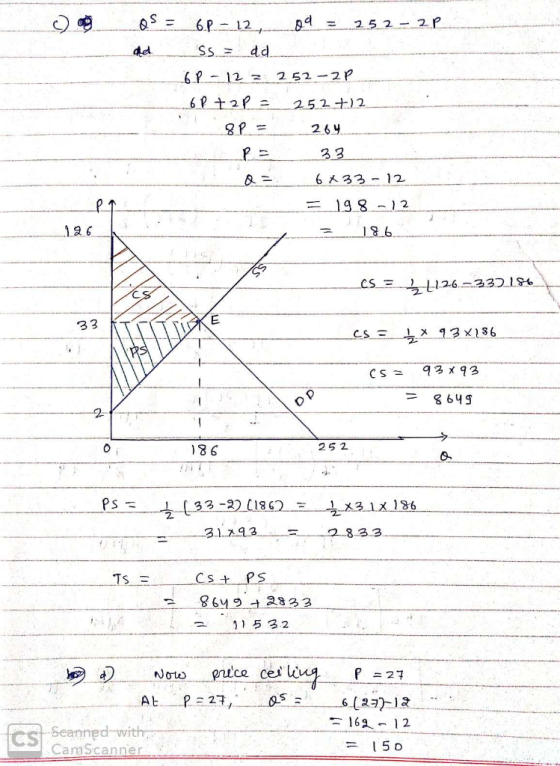
1. The supply and demand for saffron (a spice) are described by the following equations: Supply: ??=6?−12 Demand: ??=252−2? Now consider the policies proposed by each candidate:
c) Candidate A, who hates saffron, proposes banning the spice altogether. Find the CS, PS, and TS. Who would bear the larger burden of this policy – the buyer or sellers of saffron?
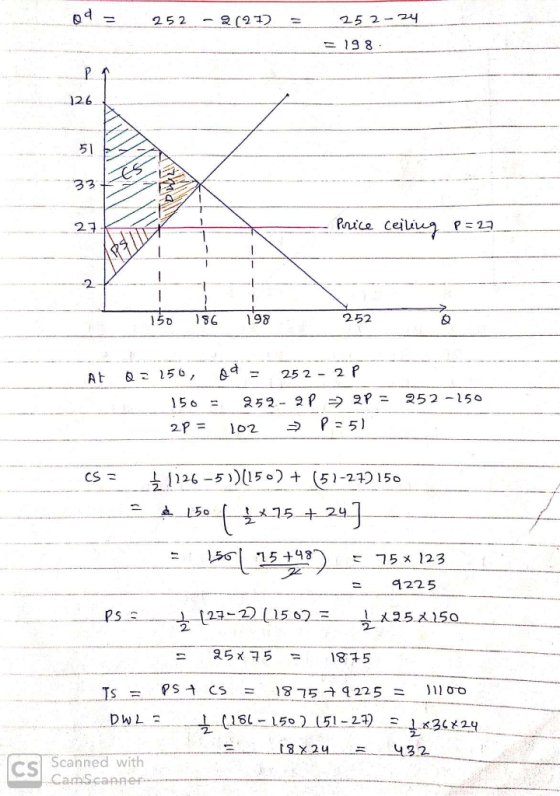
d) Candidate B likes saffron but feels it is too expenses. Thus B’s policy proposal is to place a price ceiling of $27 on saffron. How many ounces of saffron would be sold? Illustrate and calculate the impact of this policy on the CS, PS, and TS. Would consumers benefit from the price ceiling? Support your answer with no more than two sentences.
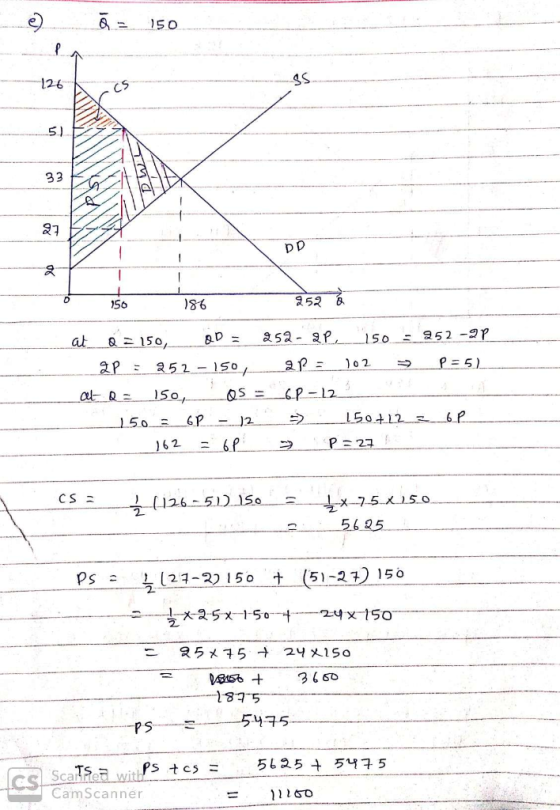
e) Candidate C prefers to set a maximum number of ounces of saffron that can be exchanged in the market at 150 ounces. Draw a graph illustrating the market supply curve that would reflect the impact of this policy. How many ounces of saffron would be sold? Find the CS, PS, and TS under this policy.
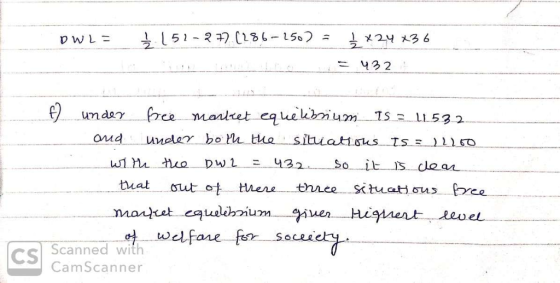
f) Which policy yields the highest level of welfare for society? Is the best of these policies preferable to the free market equilibrium? Support your answers using the amount of welfare loss from each policy.
Homework Answers
Add Answer to:
1. The supply and demand for saffron (a spice) are described by
the following equations: Supply:...
The market demand and supply is described by the following equations QD = 250 - 2P QS 3P 1) Find the market equilibrium...
 The market demand and supply is described by the following equations QD = 250 - 2P QS 3P 1) Find the market equilibrium. 2) What is the CS, PS, and W in this market? 3) Assume that the government introduces a equilibrium? price ceiling of p = 15. What is the new 4) Find the change in CS, PS, and W. Is there Dead Weight Loss? if so, of how much? 5) What does this tell you about the welfare...
The market demand and supply is described by the following equations: Q = 100 - P Q=2P - 20 1) Find the market equilibr...
 The market demand and supply is described by the following equations: Q = 100 - P Q=2P - 20 1) Find the market equilibrium 2) What is the CS, PS, and W in this market? 3) Assume that the government introduces a subsidy of 15$ per unit to the supply. What is the new equilibrium? 4) Find the change in CS, PS, and W. Is there Dead Weight Loss? if so, of how much?. 5) What does this tell you...
20. Again, consider the (inverse) demand and supply functions, respectively provided by Qa=300-10Pd (or Pd=30-(1/10)Q) and...
 20. Again, consider the (inverse) demand and supply functions, respectively provided by Qa=300-10Pd (or Pd=30-(1/10)Q) and Qs=20Ps (or Ps=(1/20)Qs) that now account for pd and Ps. Now consider t=5 where Pd. Ps=t. a. Graphically illustrate the market, new equilibrium, and economic welfare (i.e. CS, PS, TS, and DWL). b. Numerically solve for pd, ps, and the corresponding Qen. C. Numerically calculate the CS, PS, TS, and DWL.
Suppose that the market for green tea can be described by the following demand and supply...
Suppose that the market for green tea can be described by the following demand and supply curves (prices are per kg): Qd = 260 − 5P QS = 8P a) Find the market equilibrium in the absence of taxes. Draw the demand and supply curves, labelling all intercepts and the market equilibrium b) Draw the curves as in the last item, showing clearly the areas representing the consumer surplus (CS) and the producer surplus (PS). Calculate their values and the...
10 11 1U U JU11CI1115 VIVER 19. Consider the (inverse demand and supply functions, respectively pra by Qa=300-10P (...
 10 11 1U U JU11CI1115 VIVER 19. Consider the (inverse demand and supply functions, respectively pra by Qa=300-10P (or P=30-(1/10)Qd) and Qs=20P (or P=(1/20)Qs). a. Graphically illustrate and label the market, equilibrium, and es welfare (i.e. CS, PS, TS, DWL). b. Numerically calculate the CS, PS, TS, and DWL. noti
Consider the following supply and demand model derived from a small farming town qCD=.5I-.1PC (1)...
Consider the following supply and demand model derived from a small farming town qCD=.5I-.1PC (1) qCS=1.9PC+5R (2) Where equation (1) denotes the monthly demand for corn and equation (2) denotes the monthly supply for corn. (PC) is the price of corn, (I) denotes average consumer income, and (R) denotes average monthly days of rainfall. Based on the supply and demand model depicted in equations (1) and (2): If average monthly consumer income is 200 and average rainfall per...
Problem IV. Demand and supply curves for two large countries are given by figure 1. Answer...
 Problem IV. Demand and supply curves for two large countries are given by figure 1. Answer the following 1. Consider the autarky situation. (a) Calculate CS, PS, GS, and TS for both countries (3 points) 2. Now, suppo countries open to trade (a) Which country imports and which exports? (0.5 point) (b) Derive import demand for importer and export supply for exporter. You can either drawe both curves with appropriate labeling and placing numbers or write equations. ( points) (e)...
Consider the following supply and demand functions qD = 12 - 3p qS = -3 +...
Consider the following supply and demand functions qD = 12 - 3p qS = -3 + 2p Using the supply and demand functions, suppose a price ceiling of p = 2 were implemented. How much is supplied to the market and how much is demanded? What is the excess demand? Calculate the consumer surplus, producer surplus, and welfare level without the priceceiling. Calculate the consumer surplus, producer surplus, welfare level, and dead weight loss withthis price ceiling. What if the...
The following supply and demand functions describe the competitive market Q2+4P Q40-2P where Q and Q"...
 The following supply and demand functions describe the competitive market Q2+4P Q40-2P where Q and Q" are the quantities supplied and demanded, and P is the market price. (c) Suppose the government sets a production ceiling of Q- 20. Graph the impact on this market. Hint: Label your graph carefully, but don't worry about drawing it exactly to scale. (d) Compute the new producer and consumer surplus in equilibrium with the production ceiling. Then compute the change in producer and...
Problem IV. Demand and supply curves for two large countries are given by figure 1. Answer...
 Problem IV. Demand and supply curves for two large countries are given by figure 1. Answer the following questions. (38 points) 1. Consider the autarky situation. (a) Calculate CS, PS, GS, and TS for both countries. (3 povints) 2. Now, suppose countries open to trade. (a) Which country imports and which exports? (0.5 point) (1) Derive import demand for importer and export supply for exporter. You can either draw both curves with appropriate labeling and placing numbers or write equations....
 The market demand and supply is described by the following equations QD = 250 - 2P QS 3P 1) Find the market equilibrium. 2) What is the CS, PS, and W in this market? 3) Assume that the government introduces a equilibrium? price ceiling of p = 15. What is the new 4) Find the change in CS, PS, and W. Is there Dead Weight Loss? if so, of how much? 5) What does this tell you about the welfare...
 The market demand and supply is described by the following equations: Q = 100 - P Q=2P - 20 1) Find the market equilibrium 2) What is the CS, PS, and W in this market? 3) Assume that the government introduces a subsidy of 15$ per unit to the supply. What is the new equilibrium? 4) Find the change in CS, PS, and W. Is there Dead Weight Loss? if so, of how much?. 5) What does this tell you...
 20. Again, consider the (inverse) demand and supply functions, respectively provided by Qa=300-10Pd (or Pd=30-(1/10)Q) and Qs=20Ps (or Ps=(1/20)Qs) that now account for pd and Ps. Now consider t=5 where Pd. Ps=t. a. Graphically illustrate the market, new equilibrium, and economic welfare (i.e. CS, PS, TS, and DWL). b. Numerically solve for pd, ps, and the corresponding Qen. C. Numerically calculate the CS, PS, TS, and DWL.
 10 11 1U U JU11CI1115 VIVER 19. Consider the (inverse demand and supply functions, respectively pra by Qa=300-10P (or P=30-(1/10)Qd) and Qs=20P (or P=(1/20)Qs). a. Graphically illustrate and label the market, equilibrium, and es welfare (i.e. CS, PS, TS, DWL). b. Numerically calculate the CS, PS, TS, and DWL. noti
 Problem IV. Demand and supply curves for two large countries are given by figure 1. Answer the following 1. Consider the autarky situation. (a) Calculate CS, PS, GS, and TS for both countries (3 points) 2. Now, suppo countries open to trade (a) Which country imports and which exports? (0.5 point) (b) Derive import demand for importer and export supply for exporter. You can either drawe both curves with appropriate labeling and placing numbers or write equations. ( points) (e)...
 The following supply and demand functions describe the competitive market Q2+4P Q40-2P where Q and Q" are the quantities supplied and demanded, and P is the market price. (c) Suppose the government sets a production ceiling of Q- 20. Graph the impact on this market. Hint: Label your graph carefully, but don't worry about drawing it exactly to scale. (d) Compute the new producer and consumer surplus in equilibrium with the production ceiling. Then compute the change in producer and...
 Problem IV. Demand and supply curves for two large countries are given by figure 1. Answer the following questions. (38 points) 1. Consider the autarky situation. (a) Calculate CS, PS, GS, and TS for both countries. (3 povints) 2. Now, suppose countries open to trade. (a) Which country imports and which exports? (0.5 point) (1) Derive import demand for importer and export supply for exporter. You can either draw both curves with appropriate labeling and placing numbers or write equations....
Most questions answered within 3 hours.
-
Advances in technology have increased our opportunities to
connect with others. Along with the benefits of...
asked 3 minutes ago -
Compute the interest rate at which $500 per month payments
should grow to accumulate savings of...
asked 4 minutes ago -
The following information pertains to a weekly payroll of Texera
Tile Company:
a. The total wages...
asked 7 minutes ago -
Alice has the RSA public key (n, e) = (11413, 251) and private
key d =...
asked 20 minutes ago -
QUESTION 5
A drug or medicine can reach the brain more effectively by
placing the drug...
asked 23 minutes ago -
Developmental biology
A mouse contains a mutation that results in a failure of their
long
bones...
asked 19 minutes ago -
Rammazzotti, Inc., is looking for feedback on company
performance. The company compares the budget for the...
asked 25 minutes ago -
A manufacturer of chocolate chips would like to know whether its
bag filling machine works correctly...
asked 33 minutes ago -
Consider the student registration business process at
your college:
1.)Describe the steps necessary for you to...
asked 40 minutes ago -
when released from rest at point A, an unknown ion moves to
point B. At point...
asked 32 minutes ago -
A stock is expected to pay the following dividends: $1.1
four years from now, $1.4 five...
asked 38 minutes ago -
G=yellow and g=green pea seeds. You cross a heterozygous
yellow-seeded plant with a green-seeded plant to...
asked 40 minutes ago