

 PLEASE ROUND TO THE DECIMAL
PLACES GIVEN.
PLEASE ROUND TO THE DECIMAL
PLACES GIVEN.
Homework Answers
Answer:-
Page one
Page two

Thanks dear student
Add Answer to:
PLEASE ROUND TO THE DECIMAL
PLACES GIVEN.
The following regression output was obtained from a study...
The following regression output was obtained from a study of architectural firms. The dependent variable is...
The following regression output was obtained from a study of architectural firms. The dependent variable is the total amount of fees in millions of dollars. Predictor Coefficient SE Coefficient t p-value Constant 7.987 2.967 2.690 0.010 x1 0.122 0.031 3.920 0.000 x2 − 1.120 0.053 − 2.270 0.028 x3 − 0.063 0.039 − 1.610 0.114 x4 0.523 0.142 3.690 0.001 x5 − 0.065 0.040 − 1.620 0.112 Analysis of Variance Source DF SS MS F p-value Regression 5 371000 742...
The following regression output was obtained from a study of architectural firms. The dependent variable is...
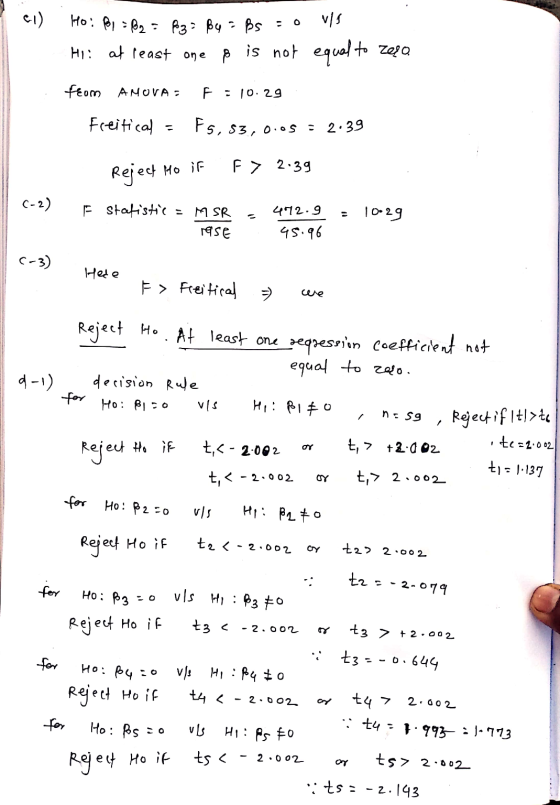
The following regression output was obtained from a study of architectural firms. The dependent variable is the total amount of fees in millions of dollars. Predictor Coefficient SE Coefficient t p-value Constant 9.048 3.135 2.886 0.010 x1 0.284 0.111 2.559 0.000 x2 − 1.116 0.581 − 1.921 0.028 x3 − 0.194 0.189 − 1.026 0.114 x4 0.583 0.336 1.735 0.001 x5 − 0.025 0.026 − 0.962 0.112 Analysis of Variance Source DF SS MS F p-value Regression 5 1,895.93 379.2...
please interpret the estimated regression equation and estimate Y.
In a regression analysis involving 30 observations, the following estimated regression equation was obtained.A. Interpret b1, b2, b3, and b4 in this estimated regression equation. Assume that for each coefficient statement, the remaining three variables are heldconstant.b1 = estimated change in y per 1 unit change in x1b2 = estimated change in y per 1 unit change in x2b3 = estimated change in y per 1 unit change in x3b4 = estimated change in y per 1 unit change in...
Use the Minitab output to answer the following questions. 1. What is the estimated value of...
 Use the Minitab output to answer the following questions. 1. What is the estimated value of B2? 2. What is the value of SST? 3. What is the value of MSR? 4. What is the value of S2? 5. What is the predicted value of Y when X1 = 7, X2 = 5, and X3 = 3? (round your answer to two decimal places) 6. What is the residual for the predicted value in question 5? The value of Y...
A regression analysis is performed using data for 36 single-family homes to predict appraised value (in...
 A regression analysis is performed using data for 36
single-family homes to predict appraised value (in thousands of
dollars) based on land area of the property (in acres), X1i, and
age (in years), X2i, in month i. Use the results below to
complete parts (a) and (b) below.
Variable
Coefficient
Standard Error
t Statistic
p-value
Intercept
392.60372
51.68272
7.60
0.0000
Area, X1
451.43475
100.48497
4.49
0.0001
Age,X2
−2.17162
0.79077
−2.75
0.0097
a. Construct a 95% confidence interval estimate...
A regression analysis is performed using data for 36
single-family homes to predict appraised value (in thousands of
dollars) based on land area of the property (in acres), X1i, and
age (in years), X2i, in month i. Use the results below to
complete parts (a) and (b) below.
Variable
Coefficient
Standard Error
t Statistic
p-value
Intercept
392.60372
51.68272
7.60
0.0000
Area, X1
451.43475
100.48497
4.49
0.0001
Age,X2
−2.17162
0.79077
−2.75
0.0097
a. Construct a 95% confidence interval estimate...
' - [2 marks] Suppose that we want to find a regression equation relating systolic blood...
 '
- [2 marks] Suppose that we want to find a regression equation relating systolic blood pressure (v) to weight (x1), age (x2) and smoking status (0 = does not smoke, 1 = smokes less than one pack per day, 2 = smokes one or more packs per day). Use the Minitab outputs below to test whether or not the smoking status variable adds to the predictive value of a model which already contains weight and age, using a =...
'
- [2 marks] Suppose that we want to find a regression equation relating systolic blood pressure (v) to weight (x1), age (x2) and smoking status (0 = does not smoke, 1 = smokes less than one pack per day, 2 = smokes one or more packs per day). Use the Minitab outputs below to test whether or not the smoking status variable adds to the predictive value of a model which already contains weight and age, using a =...
In a regression analysis involving 10 observations, the following estimated regression equation was obtained - 17.9...
 In a regression analysis involving 10 observations, the following estimated regression equation was obtained - 17.9 3 .2, -2.5x2 + 7.847 + 2.8x4 (a) Interpret b, in this estimated regression equation. 3.2 is an estimate of the change in y corresponding to a 1 unit change in x, when X, and - -2.5 is an estimate of the change in y corresponding to a 1 unit change in x, when y, y, and constant are held constant are held 2.8...
1. A professor examined the relationship between the number of hours devoted to reading, each week...
 1. A professor examined the relationship between the number of hours devoted to reading, each week Y and the independent variable social class X1), the number of years of school completed x2 and reading speed X3, in pages read per hour. The following ANOVA table obtained from a stepwise regression procedure for a sample of 19 women over 60. A) Fill in the missing values. DESS Source Regression x3 MS P value 1 1058.628 Residual 585.02 Regression X2 X3 183.743...
Use the following linear regression equation to answer the questions. X1 = 1.7 + 3.6x2 -...
 Use the following linear regression equation to answer the questions. X1 = 1.7 + 3.6x2 - 8.4x3 + 1.5x4 (a) Which variable is the response variable? O X1 O X2 O X4 O X3 Which variables are the explanatory variables? (Select all that apply.) X3 X1 U X2 (b) Which number is the constant term? List the coefficients with their corresponding explanatory variables. constant X2 coefficient X3 coefficient X4 coefficient (c) If x2 = 8, X3 = 5, and x4...
ek-tin Based on the following regression output, what proportion the total variation in Y is explained...
 ek-tin
Based on the following regression output, what proportion the total variation in Y is explained by X? Regression Statistics Multiple R 0.917214 R Square 0.841282 Adjusted R Square 0.821442 Standard Error 9.385572 Observations 10 ANOVA di SS MS Significance F 1 Regression 3735.3060 3735.30600 42.40379 0.000186 Residual 8 704.7117 88.08896 9 Total 4440.0170 Coefficients Standard Error t Stat P-value Lower 95% Intercept 31.623780 10.442970 3.028236 0.016353 7.542233 X Variable 1.131661 0.173786 6.511819 0.000186 0.730910 o a. 0.917214 o b.9.385572...
ek-tin
Based on the following regression output, what proportion the total variation in Y is explained by X? Regression Statistics Multiple R 0.917214 R Square 0.841282 Adjusted R Square 0.821442 Standard Error 9.385572 Observations 10 ANOVA di SS MS Significance F 1 Regression 3735.3060 3735.30600 42.40379 0.000186 Residual 8 704.7117 88.08896 9 Total 4440.0170 Coefficients Standard Error t Stat P-value Lower 95% Intercept 31.623780 10.442970 3.028236 0.016353 7.542233 X Variable 1.131661 0.173786 6.511819 0.000186 0.730910 o a. 0.917214 o b.9.385572...
 Use the Minitab output to answer the following questions. 1. What is the estimated value of B2? 2. What is the value of SST? 3. What is the value of MSR? 4. What is the value of S2? 5. What is the predicted value of Y when X1 = 7, X2 = 5, and X3 = 3? (round your answer to two decimal places) 6. What is the residual for the predicted value in question 5? The value of Y...
 A regression analysis is performed using data for 36
single-family homes to predict appraised value (in thousands of
dollars) based on land area of the property (in acres), X1i, and
age (in years), X2i, in month i. Use the results below to
complete parts (a) and (b) below.
Variable
Coefficient
Standard Error
t Statistic
p-value
Intercept
392.60372
51.68272
7.60
0.0000
Area, X1
451.43475
100.48497
4.49
0.0001
Age,X2
−2.17162
0.79077
−2.75
0.0097
a. Construct a 95% confidence interval estimate...
A regression analysis is performed using data for 36
single-family homes to predict appraised value (in thousands of
dollars) based on land area of the property (in acres), X1i, and
age (in years), X2i, in month i. Use the results below to
complete parts (a) and (b) below.
Variable
Coefficient
Standard Error
t Statistic
p-value
Intercept
392.60372
51.68272
7.60
0.0000
Area, X1
451.43475
100.48497
4.49
0.0001
Age,X2
−2.17162
0.79077
−2.75
0.0097
a. Construct a 95% confidence interval estimate...
 '
- [2 marks] Suppose that we want to find a regression equation relating systolic blood pressure (v) to weight (x1), age (x2) and smoking status (0 = does not smoke, 1 = smokes less than one pack per day, 2 = smokes one or more packs per day). Use the Minitab outputs below to test whether or not the smoking status variable adds to the predictive value of a model which already contains weight and age, using a =...
'
- [2 marks] Suppose that we want to find a regression equation relating systolic blood pressure (v) to weight (x1), age (x2) and smoking status (0 = does not smoke, 1 = smokes less than one pack per day, 2 = smokes one or more packs per day). Use the Minitab outputs below to test whether or not the smoking status variable adds to the predictive value of a model which already contains weight and age, using a =...
 In a regression analysis involving 10 observations, the following estimated regression equation was obtained - 17.9 3 .2, -2.5x2 + 7.847 + 2.8x4 (a) Interpret b, in this estimated regression equation. 3.2 is an estimate of the change in y corresponding to a 1 unit change in x, when X, and - -2.5 is an estimate of the change in y corresponding to a 1 unit change in x, when y, y, and constant are held constant are held 2.8...
 1. A professor examined the relationship between the number of hours devoted to reading, each week Y and the independent variable social class X1), the number of years of school completed x2 and reading speed X3, in pages read per hour. The following ANOVA table obtained from a stepwise regression procedure for a sample of 19 women over 60. A) Fill in the missing values. DESS Source Regression x3 MS P value 1 1058.628 Residual 585.02 Regression X2 X3 183.743...
 Use the following linear regression equation to answer the questions. X1 = 1.7 + 3.6x2 - 8.4x3 + 1.5x4 (a) Which variable is the response variable? O X1 O X2 O X4 O X3 Which variables are the explanatory variables? (Select all that apply.) X3 X1 U X2 (b) Which number is the constant term? List the coefficients with their corresponding explanatory variables. constant X2 coefficient X3 coefficient X4 coefficient (c) If x2 = 8, X3 = 5, and x4...
 ek-tin
Based on the following regression output, what proportion the total variation in Y is explained by X? Regression Statistics Multiple R 0.917214 R Square 0.841282 Adjusted R Square 0.821442 Standard Error 9.385572 Observations 10 ANOVA di SS MS Significance F 1 Regression 3735.3060 3735.30600 42.40379 0.000186 Residual 8 704.7117 88.08896 9 Total 4440.0170 Coefficients Standard Error t Stat P-value Lower 95% Intercept 31.623780 10.442970 3.028236 0.016353 7.542233 X Variable 1.131661 0.173786 6.511819 0.000186 0.730910 o a. 0.917214 o b.9.385572...
ek-tin
Based on the following regression output, what proportion the total variation in Y is explained by X? Regression Statistics Multiple R 0.917214 R Square 0.841282 Adjusted R Square 0.821442 Standard Error 9.385572 Observations 10 ANOVA di SS MS Significance F 1 Regression 3735.3060 3735.30600 42.40379 0.000186 Residual 8 704.7117 88.08896 9 Total 4440.0170 Coefficients Standard Error t Stat P-value Lower 95% Intercept 31.623780 10.442970 3.028236 0.016353 7.542233 X Variable 1.131661 0.173786 6.511819 0.000186 0.730910 o a. 0.917214 o b.9.385572...
Most questions answered within 3 hours.
-
How many grams of ice at -5.7 ∘C can be completely converted to
liquid at 20.0...
asked 1 minute from now -
Chapter 15 Global Business Today by Charles W.L.Hill
Know the factors that influence whether a firm...
asked 1 minute from now -
Arrange these halides in decreasing order of reactivity toward
I- in acetone:
n-butyl bromide, sec-butyl bromide,...
asked 18 minutes ago -
Light from a helium-neon laser (λ = 632.8 nm) passes through a
single slit. The angle...
asked 14 minutes ago -
A rod made of cobalt with a mass of 0.80 kg is heated to 850°C,
then...
asked 20 minutes ago -
Suppose the price elasticity of demand for movies is -1.5. If
the price of movies increase...
asked 21 minutes ago -
Two resistors, of 3.2 Ω and 5.8 Ω, are connected in parallel to
the terminals of...
asked 19 minutes ago -
Regardless of the system used in departmental cost analysis:
Multiple Choice
Neither direct nor indirect costs...
asked 24 minutes ago -
The peak voltage of the source from problem 4 is 12 V. You
notice that the...
asked 34 minutes ago -
scientist have determined that some people are born with a very
small hole in their heart....
asked 37 minutes ago -
Calculate [H3O+] in the following aqueous solution at 25 ∘C:
[OH−]= 1.0×10⁻⁹ M .
Calculate [H3O+]...
asked 41 minutes ago -
The total vapor pressure above a binary solution of components A
and B is found to...
asked 40 minutes ago