

Homework Answers

Add Answer to:
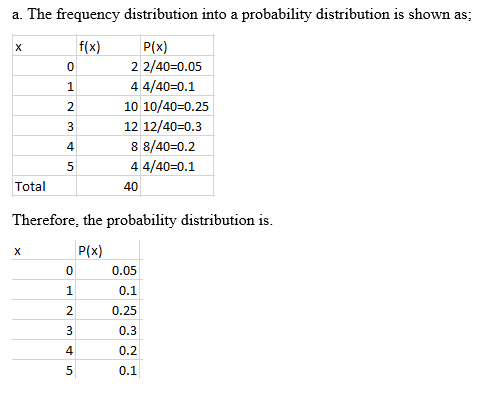
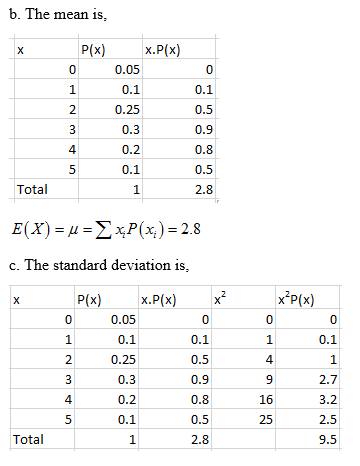
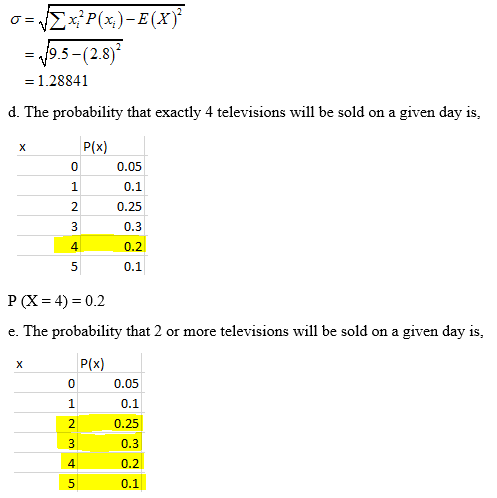
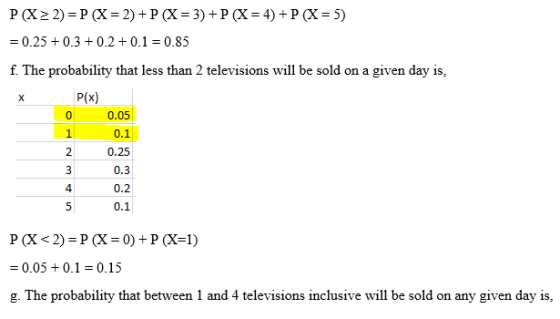
QUESTION 1 (15 marks) Studd Enterprises sells big-screen televisions. A concern of management is the number...
Assume the hold time of callers to a cable company is normally distributed with a mean...
Assume the hold time of callers to a cable company is normally distributed with a mean of 5.0 minutes and a standard deviation of 0.6 minute. Determine the percent of callers who are on hold at least 5.2 minutes. _______% Use Standard Distribution Table Z 0.00 0.01 0.02 0.03 0.04 0.05 0.06 0.07 0.08 0.09 0.0 0.0000 0.0040 0.0080 0.0120 0.0160 0.0199 0.0239 0.0279 0.0319 0.0359 0.1 0.0398 0.0438 0.0478 0.0517 0.0557 0.0596 0.0636 0.0675 0.0714 0.0753 0.2 0.0793 0.0832...
1. What percentage of the general population have deviation IQs higher than 115?
1. What percentage of the general population have deviation IQs higher than 115? Appendix AAreas under the standard normal curveArea between 0 and z0.000.010.020.030.040.050.060.070.080.090.00.00000.00400.00800.01200.01600.01990.02390.02790.03190.03590.10.03980.04380.04780.05170.05570.05960.06360.06750.07140.07530.20.07930.08320.08710.09100.09480.09870.10260.10640.11030.11410.30.11790.12170.12550.12930.13310.13680.14060.14430.14800.15170.40.15540.15910.16280.16640.17000.17360.17720.18080.18440.18790.50.19150.19500.19850.20190.20540.20880.21230.21570.21900.22240.60.22570.22910.23240.23570.23890.24220.24540.24860.25170.25490.70.25800.26110.26420.26730.27040.27340.27640.27940.28230.28520.80.28810.29100.29390.29670.29950.30230.30510.30780.31060.31330.90.31590.31860.32120.32380.32640.32890.33150.33400.33650.33891.00.34130.34380.34610.34850.35080.35310.35540.35770.35990.36211.10.36430.36650.36860.37080.37290.37490.37700.37900.38100.38301.20.38490.38690.38880.39070.39250.39440.39620.39800.39970.40151.30.40320.40490.40660.40820.40990.41150.41310.41470.41620.41771.40.41920.42070.42220.42360.42510.42650.42790.42920.43060.43191.50.43320.43450.43570.43700.43820.43940.44060.44180.44290.44411.60.44520.44630.44740.44840.44950.45050.45150.45250.45350.45451.70.45540.45640.45730.45820.45910.45990.46080.46160.46250.46331.80.46410.46490.46560.46640.46710.46780.46860.46930.46990.47061.90.47130.47190.47260.47320.47380.47440.47500.47560.47610.47672.00.47720.47780.47830.47880.47930.47980.48030.48080.48120.48172.10.48210.48260.48300.48340.48380.48420.48460.48500.48540.48572.20.48610.48640.48680.48710.48750.48780.48810.48840.48870.48902.30.48930.48960.48980.49010.49040.49060.49090.49110.49130.49162.40.49180.49200.49220.49250.49270.49290.49310.49320.49340.49362.50.49380.49400.49410.49430.49450.49460.49480.49490.49510.49522.60.49530.49550.49560.49570.49590.49600.49610.49620.49630.49642.70.49650.49660.49670.49680.49690.49700.49710.49720.49730.49742.80.49740.49750.49760.49770.49770.49780.49790.49790.49800.49812.90.49810.49820.49820.49830.49840.49840.49850.49850.49860.49863.00.49870.49870.49870.49880.49880.49890.49890.49890.49900.49902. What proportion of the normal curve lies between a Z-score of -2.50 and a Z-score of 1.50?3. What proportion of the scores in a normal distribution are higher than a T-score of 70?4. What Z-score has 90% of the scores below it?5. What deviation IQ score ranges would include 90% of the population?
Question No: 3 (a) A factory produces 2.5% of defective items.If a sample of 200 items...
 Question No: 3 (a) A factory produces 2.5% of defective items.If a sample of 200 items is taken at random from the production. What is the probability that there will be at least four collision in a week? (2 Marks) 50,where t (b) The failure distribution function F(t) of a building system is given F(t) = 1-e is in years. Determine the following: (i) The system will last more than 6 years (ii) hazard function h(t) (3 Marks) (C) A...
For the following precedence relationship, answer questions 5 thru 9. Activity Preceding Activity Optimistic Time (weeks)...
 For the following precedence relationship, answer questions 5 thru 9. Activity Preceding Activity Optimistic Time (weeks) 10 Most Likely Time (weeks) 222 Pessimistic Time (weeks) A CD 5. The project duration for the above project is: a 25 weeks b. 30 weeks c. 40 weeks d. 38 weeks 6. The slack for activity Cis: a. O weeks b. 3 weeks C 5 weeks d. 7 weeks 7. The critical path for the above project is: a. ACHEG b. A-D-E-G C....
CRA CDs Inc. wants the mean lengths of the “cuts” on a CD to be 170...
 CRA CDs Inc. wants the mean lengths of the “cuts” on a CD to be
170 seconds (2 minutes and 50 seconds). This will allow the disk
jockeys to have plenty of time for commercials within each
10-minute segment. Assume the distribution of the length of the
cuts follows a normal distribution with a standard deviation of
nine seconds. Suppose that we select a sample of 16 cuts from
various CDs sold by CRA CDs Inc. Use Appendix B.1 for...
CRA CDs Inc. wants the mean lengths of the “cuts” on a CD to be
170 seconds (2 minutes and 50 seconds). This will allow the disk
jockeys to have plenty of time for commercials within each
10-minute segment. Assume the distribution of the length of the
cuts follows a normal distribution with a standard deviation of
nine seconds. Suppose that we select a sample of 16 cuts from
various CDs sold by CRA CDs Inc. Use Appendix B.1 for...
SCENARIO A Answer the questions in the following scenario. Be sure to show all your working....
 SCENARIO A
Answer the questions in the following scenario. Be sure
to show all your working.
The scenario is for the 2017/18 financial year. You will
need to refer to the Australian Taxation Office’s (ATO’s) website
for the tax rates and the medicare levy. Include the URL reference
or a screen shot to demonstrate the information you
obtained.
Stevie Slick is a real estate agent. She earn $583 per week plus
a commission of 0.5% on properties she sells. In...
SCENARIO A
Answer the questions in the following scenario. Be sure
to show all your working.
The scenario is for the 2017/18 financial year. You will
need to refer to the Australian Taxation Office’s (ATO’s) website
for the tax rates and the medicare levy. Include the URL reference
or a screen shot to demonstrate the information you
obtained.
Stevie Slick is a real estate agent. She earn $583 per week plus
a commission of 0.5% on properties she sells. In...
 Question No: 3 (a) A factory produces 2.5% of defective items.If a sample of 200 items is taken at random from the production. What is the probability that there will be at least four collision in a week? (2 Marks) 50,where t (b) The failure distribution function F(t) of a building system is given F(t) = 1-e is in years. Determine the following: (i) The system will last more than 6 years (ii) hazard function h(t) (3 Marks) (C) A...
 For the following precedence relationship, answer questions 5 thru 9. Activity Preceding Activity Optimistic Time (weeks) 10 Most Likely Time (weeks) 222 Pessimistic Time (weeks) A CD 5. The project duration for the above project is: a 25 weeks b. 30 weeks c. 40 weeks d. 38 weeks 6. The slack for activity Cis: a. O weeks b. 3 weeks C 5 weeks d. 7 weeks 7. The critical path for the above project is: a. ACHEG b. A-D-E-G C....
 CRA CDs Inc. wants the mean lengths of the “cuts” on a CD to be
170 seconds (2 minutes and 50 seconds). This will allow the disk
jockeys to have plenty of time for commercials within each
10-minute segment. Assume the distribution of the length of the
cuts follows a normal distribution with a standard deviation of
nine seconds. Suppose that we select a sample of 16 cuts from
various CDs sold by CRA CDs Inc. Use Appendix B.1 for...
CRA CDs Inc. wants the mean lengths of the “cuts” on a CD to be
170 seconds (2 minutes and 50 seconds). This will allow the disk
jockeys to have plenty of time for commercials within each
10-minute segment. Assume the distribution of the length of the
cuts follows a normal distribution with a standard deviation of
nine seconds. Suppose that we select a sample of 16 cuts from
various CDs sold by CRA CDs Inc. Use Appendix B.1 for...
 SCENARIO A
Answer the questions in the following scenario. Be sure
to show all your working.
The scenario is for the 2017/18 financial year. You will
need to refer to the Australian Taxation Office’s (ATO’s) website
for the tax rates and the medicare levy. Include the URL reference
or a screen shot to demonstrate the information you
obtained.
Stevie Slick is a real estate agent. She earn $583 per week plus
a commission of 0.5% on properties she sells. In...
SCENARIO A
Answer the questions in the following scenario. Be sure
to show all your working.
The scenario is for the 2017/18 financial year. You will
need to refer to the Australian Taxation Office’s (ATO’s) website
for the tax rates and the medicare levy. Include the URL reference
or a screen shot to demonstrate the information you
obtained.
Stevie Slick is a real estate agent. She earn $583 per week plus
a commission of 0.5% on properties she sells. In...
Most questions answered within 3 hours.
-
(Expected rate of return and risk) Carter Inc. is evaluating a
security. Calculate the investment’s expected...
asked 9 minutes ago -
What specific indicators can point to lack of progress for
African Americans in American society?
asked 1 hour ago -
1-The Electrons in a beam are moving at 2.7×10⁸ m/s in an
electric field of 15000...
asked 1 hour ago -
A gas tank is a vertical cylinder. It has a radius of 1m, a
height of...
asked 1 hour ago -
Accent Software faces the following conditions. All of these
support Accent’s use of a market-penetration pricing...
asked 2 hours ago -
A mathematically inclined friend emails you the following
instructions: "Meet me in the cafeteria the first...
asked 2 hours ago -
A monopoly sells in two countries . The demand curves in the two
countries are p1...
asked 3 hours ago -
A .15kg rubber ball is bounced off a wall. Before hitting the
wall, the ball moves...
asked 4 hours ago -
A manufacturing company preparing to build a new plant is
considering three potential locations for it....
asked 4 hours ago -
B. If compound Y has approximately the same values of solubility
in toluene as compound X,...
asked 5 hours ago -
Oscar Inc. has inventory in Japan valued at 39,051,000 Yen one
year ago. One year ago...
asked 5 hours ago -
If Canada suffered from "fundamental disequilibrium," and its
government choose not to devalue its currency, a...
asked 5 hours ago