The following data were collected as part of a study of coffee consumption among medical students....
The following data were collected as part of a study of coffee consumption among medical students. The following reflect cups per day consumed:
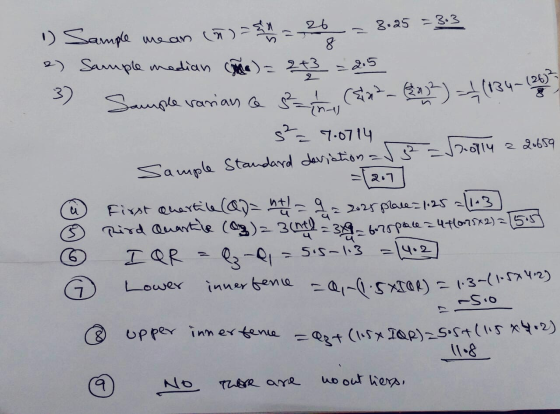
3 4 6 8 2 1 0 2
First, put the data in order from lowest to highest:
0, 1, 2, 2, 3, 4, 6, 8
This will help you to find the median and the quartiles!
1) Compute the sample mean and round to one decimal place (see page 100). ____
2) Compute the sample median
and round to one decimal place (see page 88). _____
3) Compute the sample standard
deviation and round to one decimal place. I have computed
the sample variance for you = 7.36 (see page 110).
______
(see page 88-91 for quartiles and outliers)
The interquartile range (IQR) is a number that indicates the spread of the middle half or the middle 50% of the data. It is the difference between the third quartile (Q3) and the first quartile (Q1). IQR = Q3 – Q1
The IQR can help to determine potential outliers. A value is suspected to be a potential outlier if it is less than (1.5)(IQR) below the first quartile or more than (1.5)(IQR) above the third quartile. Potential outliers always require further investigation.
4) Compute the first quartile and round to one decimal place. ______
5) Compute the third quartile and round to one decimal place. _____
6) Compute the interquartile range and round to one decimal place. _____
Checking for outliers requires two answers, both #7 & 8):
7) Using the interquartile range, calculate for outliers and round to two decimal places. _______
8) Using the interquartile range, calculate for outliers and round to two decimal places. _______
9) Are there any outliers? Yes or no? ______
Homework Answers
Add Answer to:
The following data were collected as part of a study of coffee
consumption among medical students....
The following data were collected as part of a study of coffee consumption among medical students....
 The following data were collected as part of a study of coffee consumption among medical students. The following reflect cups per day consumed: First, put the data in order from lowest to highest: 0, 1, 2, 2, 3, 4, 6, 8 This will help you to find the median and the quartiles! 1) Compute the sample mean and round to ane decimal place (see page 100 2) Compute the sample median and round to one decimal place (see page 88)....
The following data were collected as part of a study of coffee consumption among medical students....
 The following data were collected as part of a study of coffee consumption among medical students. The following reflect cups per day consumed: First, put the data in order from lowest to highest: 0, 1, 2, 2, 3, 4, 6, 8 This will help you to find the median and the quartiles 1) Compute the sample mean and round to one decimal place (see page 100), 2) Compute the sample median and round to one decimal place (see page 88)...
This Quesuon: 1 pt Use the accompanying data set to complete the following actions. a. Find...
 This Quesuon: 1 pt Use the accompanying data set to complete the following actions. a. Find the quartiles. b. Find the interquartile range. c. Identify any outliers. 60 62 55 65 57 63 56 57 65 63 64 63 59 54 78 0 a. Find the quartiles. The first quartile, Qq, is The second quartile, Q2, is The third quartile, Q3, is . (Type integers or decimals.) b. Find the interquartile range. The interquartile range (IQR) is . (Type an...
Please help Use the accompanying data set to complete the following actions. a. Find the quartiles....
 Please help
Use the accompanying data set to complete the following actions. a. Find the quartiles. b. Find the interquartile range. c. Identify any outliers. 40 52 37 43 41 38 41 46 43 37 35 56 43 34 15 53 37 51 30 30 a. Find the quartiles. The first quartile, Q7, is The second quartile, Q2, is The third quartile, Q3, is (Type integers or decimals.) b. Find the interquartile range. The interquartile range (IQR) is (Type an...
Please help
Use the accompanying data set to complete the following actions. a. Find the quartiles. b. Find the interquartile range. c. Identify any outliers. 40 52 37 43 41 38 41 46 43 37 35 56 43 34 15 53 37 51 30 30 a. Find the quartiles. The first quartile, Q7, is The second quartile, Q2, is The third quartile, Q3, is (Type integers or decimals.) b. Find the interquartile range. The interquartile range (IQR) is (Type an...
Use the accompanying data set to complete the following actions. a. Find the quartiles. b. Find...
 Use the accompanying data set to complete the following actions. a. Find the quartiles. b. Find the interquartile range. c. Identify any outliers. 41 53 37 44 40 36 39 47 43 39 34 56 42 36 15 51 39 50 29 29 0 a. Find the quartiles. The first quartile, Q7, is The second quartile, Q2, is The third quartile, Q3, is (Type integers or decimals.) b. Find the interquartile range. The interquartile range (IQR) is (Type an integer...
is QUEST Use the accompanying data set to complete the following actions. a. Find the quartiles....
 is QUEST Use the accompanying data set to complete the following actions. a. Find the quartiles. b. Find the interquartile range c. Identify any outliers 62 62 65 55 56 62 63 57 61 60 64 63 59 64 78 a. Find the quartiles The first quartile, Q, is The second quartile, Q,, is The third quartile, Q3, is (Type integers or decimals) b. Find the interquartile range The interquartie range (IQR) is (Type an integer or a decimal.) c....
6). a.b. The accompanying data represent the miles per gallon of a random sample of cars...
 6).
a.b.
The accompanying data represent the miles per gallon of a random sample of cars with a three-cylinder, 1.0 liter engine. (a) Compute the z-score corresponding to the individual who obtained 43.7 miles per gallon. Interpret this result. (b) Determine the quartiles. (c) Compute and interpret the interquartile range, IQR. (d) Determine the lower and upper fences. Are there any outliers? E Click the icon to view the data. (a) Compute the z-score corresponding to the individual who obtained...
6).
a.b.
The accompanying data represent the miles per gallon of a random sample of cars with a three-cylinder, 1.0 liter engine. (a) Compute the z-score corresponding to the individual who obtained 43.7 miles per gallon. Interpret this result. (b) Determine the quartiles. (c) Compute and interpret the interquartile range, IQR. (d) Determine the lower and upper fences. Are there any outliers? E Click the icon to view the data. (a) Compute the z-score corresponding to the individual who obtained...
Would the outlier be 43.5 or 54? And same for would it 78 or 88.5? PART...
 Would the outlier be 43.5 or 54? And same for would it 78 or
88.5? PART C
Use the accompanying data set to complete the following actions. a. Find the quartiles. b. Find the interquartile range. c. Identify any outliers. 62 65 57 64 57 54 64 62 65 57 58 57 59 56 78 O The first quartile, Qy, is 57|. The second quartile, Q2, is 59 The third quartile, Q3, is 64. (Type integers or decimals.) b. Find...
Would the outlier be 43.5 or 54? And same for would it 78 or
88.5? PART C
Use the accompanying data set to complete the following actions. a. Find the quartiles. b. Find the interquartile range. c. Identify any outliers. 62 65 57 64 57 54 64 62 65 57 58 57 59 56 78 O The first quartile, Qy, is 57|. The second quartile, Q2, is 59 The third quartile, Q3, is 64. (Type integers or decimals.) b. Find...
C. Approximately 50% of the data lie above this value. D. Approximately 50% of the data lie wit...
 C. Approximately 50% of the data lie above this value.
D. Approximately 50% of the data lie within 1 standard
deviation of this value.
The given data represents the results of a study on infant mortality rates (number of infant deaths per 1000 live births) by country. Full data set 85 133 93 91 114 94 93 72 139 94 98 121 72 105 Use the data table to answer the following questions. a. Find the first quartile (Q1) and...
C. Approximately 50% of the data lie above this value.
D. Approximately 50% of the data lie within 1 standard
deviation of this value.
The given data represents the results of a study on infant mortality rates (number of infant deaths per 1000 live births) by country. Full data set 85 133 93 91 114 94 93 72 139 94 98 121 72 105 Use the data table to answer the following questions. a. Find the first quartile (Q1) and...
a,b,c The accompanying data represent the miles per gallon of a random sample of cars with...
 a,b,c
The accompanying data represent the miles per gallon of a random sample of cars with a three-cylinder, 1.0 liter engine. (a) Determine the quartiles (b) Compute the interquartile range, IQR (c) Determine the lower and upper fences. Are there any outliers? B! Click the icon to view the MPG Data (a) Determine the quartiles. Q,- mpg (Type an integer or a decimal Q,- mpg (Type an integer or a decimal (b) Compute the interquartile (Type an integer or a...
a,b,c
The accompanying data represent the miles per gallon of a random sample of cars with a three-cylinder, 1.0 liter engine. (a) Determine the quartiles (b) Compute the interquartile range, IQR (c) Determine the lower and upper fences. Are there any outliers? B! Click the icon to view the MPG Data (a) Determine the quartiles. Q,- mpg (Type an integer or a decimal Q,- mpg (Type an integer or a decimal (b) Compute the interquartile (Type an integer or a...
 The following data were collected as part of a study of coffee consumption among medical students. The following reflect cups per day consumed: First, put the data in order from lowest to highest: 0, 1, 2, 2, 3, 4, 6, 8 This will help you to find the median and the quartiles! 1) Compute the sample mean and round to ane decimal place (see page 100 2) Compute the sample median and round to one decimal place (see page 88)....
 The following data were collected as part of a study of coffee consumption among medical students. The following reflect cups per day consumed: First, put the data in order from lowest to highest: 0, 1, 2, 2, 3, 4, 6, 8 This will help you to find the median and the quartiles 1) Compute the sample mean and round to one decimal place (see page 100), 2) Compute the sample median and round to one decimal place (see page 88)...
 This Quesuon: 1 pt Use the accompanying data set to complete the following actions. a. Find the quartiles. b. Find the interquartile range. c. Identify any outliers. 60 62 55 65 57 63 56 57 65 63 64 63 59 54 78 0 a. Find the quartiles. The first quartile, Qq, is The second quartile, Q2, is The third quartile, Q3, is . (Type integers or decimals.) b. Find the interquartile range. The interquartile range (IQR) is . (Type an...
 Please help
Use the accompanying data set to complete the following actions. a. Find the quartiles. b. Find the interquartile range. c. Identify any outliers. 40 52 37 43 41 38 41 46 43 37 35 56 43 34 15 53 37 51 30 30 a. Find the quartiles. The first quartile, Q7, is The second quartile, Q2, is The third quartile, Q3, is (Type integers or decimals.) b. Find the interquartile range. The interquartile range (IQR) is (Type an...
Please help
Use the accompanying data set to complete the following actions. a. Find the quartiles. b. Find the interquartile range. c. Identify any outliers. 40 52 37 43 41 38 41 46 43 37 35 56 43 34 15 53 37 51 30 30 a. Find the quartiles. The first quartile, Q7, is The second quartile, Q2, is The third quartile, Q3, is (Type integers or decimals.) b. Find the interquartile range. The interquartile range (IQR) is (Type an...
 Use the accompanying data set to complete the following actions. a. Find the quartiles. b. Find the interquartile range. c. Identify any outliers. 41 53 37 44 40 36 39 47 43 39 34 56 42 36 15 51 39 50 29 29 0 a. Find the quartiles. The first quartile, Q7, is The second quartile, Q2, is The third quartile, Q3, is (Type integers or decimals.) b. Find the interquartile range. The interquartile range (IQR) is (Type an integer...
 is QUEST Use the accompanying data set to complete the following actions. a. Find the quartiles. b. Find the interquartile range c. Identify any outliers 62 62 65 55 56 62 63 57 61 60 64 63 59 64 78 a. Find the quartiles The first quartile, Q, is The second quartile, Q,, is The third quartile, Q3, is (Type integers or decimals) b. Find the interquartile range The interquartie range (IQR) is (Type an integer or a decimal.) c....
 6).
a.b.
The accompanying data represent the miles per gallon of a random sample of cars with a three-cylinder, 1.0 liter engine. (a) Compute the z-score corresponding to the individual who obtained 43.7 miles per gallon. Interpret this result. (b) Determine the quartiles. (c) Compute and interpret the interquartile range, IQR. (d) Determine the lower and upper fences. Are there any outliers? E Click the icon to view the data. (a) Compute the z-score corresponding to the individual who obtained...
6).
a.b.
The accompanying data represent the miles per gallon of a random sample of cars with a three-cylinder, 1.0 liter engine. (a) Compute the z-score corresponding to the individual who obtained 43.7 miles per gallon. Interpret this result. (b) Determine the quartiles. (c) Compute and interpret the interquartile range, IQR. (d) Determine the lower and upper fences. Are there any outliers? E Click the icon to view the data. (a) Compute the z-score corresponding to the individual who obtained...
 Would the outlier be 43.5 or 54? And same for would it 78 or
88.5? PART C
Use the accompanying data set to complete the following actions. a. Find the quartiles. b. Find the interquartile range. c. Identify any outliers. 62 65 57 64 57 54 64 62 65 57 58 57 59 56 78 O The first quartile, Qy, is 57|. The second quartile, Q2, is 59 The third quartile, Q3, is 64. (Type integers or decimals.) b. Find...
Would the outlier be 43.5 or 54? And same for would it 78 or
88.5? PART C
Use the accompanying data set to complete the following actions. a. Find the quartiles. b. Find the interquartile range. c. Identify any outliers. 62 65 57 64 57 54 64 62 65 57 58 57 59 56 78 O The first quartile, Qy, is 57|. The second quartile, Q2, is 59 The third quartile, Q3, is 64. (Type integers or decimals.) b. Find...
 C. Approximately 50% of the data lie above this value.
D. Approximately 50% of the data lie within 1 standard
deviation of this value.
The given data represents the results of a study on infant mortality rates (number of infant deaths per 1000 live births) by country. Full data set 85 133 93 91 114 94 93 72 139 94 98 121 72 105 Use the data table to answer the following questions. a. Find the first quartile (Q1) and...
C. Approximately 50% of the data lie above this value.
D. Approximately 50% of the data lie within 1 standard
deviation of this value.
The given data represents the results of a study on infant mortality rates (number of infant deaths per 1000 live births) by country. Full data set 85 133 93 91 114 94 93 72 139 94 98 121 72 105 Use the data table to answer the following questions. a. Find the first quartile (Q1) and...
 a,b,c
The accompanying data represent the miles per gallon of a random sample of cars with a three-cylinder, 1.0 liter engine. (a) Determine the quartiles (b) Compute the interquartile range, IQR (c) Determine the lower and upper fences. Are there any outliers? B! Click the icon to view the MPG Data (a) Determine the quartiles. Q,- mpg (Type an integer or a decimal Q,- mpg (Type an integer or a decimal (b) Compute the interquartile (Type an integer or a...
a,b,c
The accompanying data represent the miles per gallon of a random sample of cars with a three-cylinder, 1.0 liter engine. (a) Determine the quartiles (b) Compute the interquartile range, IQR (c) Determine the lower and upper fences. Are there any outliers? B! Click the icon to view the MPG Data (a) Determine the quartiles. Q,- mpg (Type an integer or a decimal Q,- mpg (Type an integer or a decimal (b) Compute the interquartile (Type an integer or a...
Most questions answered within 3 hours.
-
The
serum cholesterol levels of a population of kids follow a normal
distribution with mean 155...
asked 15 minutes ago -
han discusses the racist practice of badlands, a bar
in the Castro
district of San Francisco,...
asked 27 minutes ago -
A sample of final exam scores is normally distributed with a
mean equal to 25 and...
asked 31 minutes ago -
An investor shorts 100 shares of a stock when the share price is
$50 and closes...
asked 35 minutes ago -
LLOP corporation just paid 4$ dividend per share, you expect the
dividend to grow 8% for...
asked 44 minutes ago -
if we subtract 1000 from 0001 is there overflow? (binary)
asked 52 minutes ago -
Hello, I need help with the function below, The language I am
using is Ocaml
open...
asked 54 minutes ago -
Explain how the presence of glucose represses the gal structural
genes?
asked 1 hour ago -
For the reaction CaI2+2AgNO3⟶2AgI+Ca(NO3)2 how many grams of
silver iodide, AgI, are produced from 56.5 g...
asked 1 hour ago -
Write an equation for hydrolysis via acid catalysis.
Using ethyl acetate, ethyl benzoate, ethyl formate or...
asked 1 hour ago -
Only one graph is needed.
(a) Draw a Supply Curve and the Demand Curve for the...
asked 1 hour ago -
Fill in the blanks and please show how you arrived at numerical
answers
. The...
asked 1 hour ago