

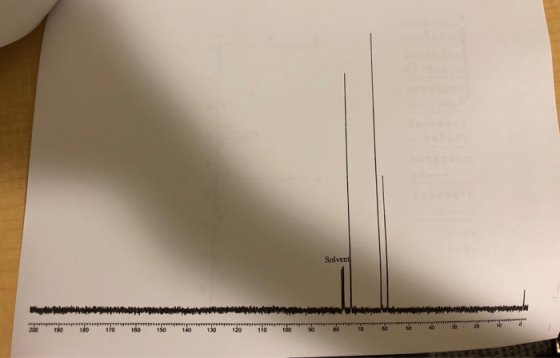


![-NC-NMR Analysis 1. [1 pt] a. From your spectrum, how many different types of carbon are present in your compound? b. Based o](http://img.homeworklib.com/questions/be5908d0-a7d1-11ea-bd8e-71cc841fd8bb.png?x-oss-process=image/resize,w_560)
Homework Answers

![Ms Analysis J. Mt = 76 mt = [ (H3-D-CH=CH-OH]T 2. Base peak m/2 =45 (with highest intensity) [CH]- DJ Hz-CH-OH)* 5 [CH2=CH, O](http://img.homeworklib.com/questions/b6a01bd0-a7d2-11ea-b839-73470a8c9ce0.png?x-oss-process=image/resize,w_560)


Add Answer to:
need help figuring my unknown and answering these questions
please number every question and explain...studying for...
can i please get help on identifying my unknown and answering the questions for each part....
 can
i please get help on identifying my unknown and answering the
questions for each part. and please explain because i will be given
an exam like this and want to really understand.
n 122240 2019 (GMT-04 00h 94 92 90 88 86 84 82 80 78 76 74 72 70 68 66 64 1000 1500 2000 2500 3000 3500 4000 Wavenumbers (cm-1) Date: Tue Jun 11 12:22:40 2019 (GMT-04:00kaoutar elbar Scans: 8 Resolution: 4.000 onemea1% RH 003 Q1L 129...
can
i please get help on identifying my unknown and answering the
questions for each part. and please explain because i will be given
an exam like this and want to really understand.
n 122240 2019 (GMT-04 00h 94 92 90 88 86 84 82 80 78 76 74 72 70 68 66 64 1000 1500 2000 2500 3000 3500 4000 Wavenumbers (cm-1) Date: Tue Jun 11 12:22:40 2019 (GMT-04:00kaoutar elbar Scans: 8 Resolution: 4.000 onemea1% RH 003 Q1L 129...
need help figuring the unknown and starting these questions. Identify the important (diagnostic) peaks from the...
 need help figuring the unknown and starting these
questions.
Identify the important (diagnostic) peaks from the IR spectrum. corresponds to each peak below. Be sure to also add labels your IR spectrum (write the corresponding bond type next to each peak on the IR spectrum itself) 2. List the cm 1 and the bond that 3. List all possible classes of compounds that your unknown could be (i.e. could the unknown be a ketone, alcohol, ester, carboxylic acid? does the...
need help figuring the unknown and starting these
questions.
Identify the important (diagnostic) peaks from the IR spectrum. corresponds to each peak below. Be sure to also add labels your IR spectrum (write the corresponding bond type next to each peak on the IR spectrum itself) 2. List the cm 1 and the bond that 3. List all possible classes of compounds that your unknown could be (i.e. could the unknown be a ketone, alcohol, ester, carboxylic acid? does the...
Unknown H415 100 50 1000 1S00 2000 3000 BRVENUMBERI 4000 Unknown H415 ЗН 1 H-N 2H,...
 Unknown H415 100 50 1000 1S00 2000 3000 BRVENUMBERI 4000 Unknown H415 ЗН 1 H-N 2H, q 1H, d 5H, m 1H, d 0 1 2 3 6 7 8 10 11 ppm HSP-00-049 Unknown H415 q 140 120 100 200 180 160 ppm CDS-00-726 20 -40 60 80 Relative Intensity 09 Unknown H415 100 MS-NJ-0442 80 20 thmpt 25 50 75 100 125 150 175 m/z Date: Name: Section/Group: Instructor: Report Sheet: Laboratory 14 MS,IR, 13C NMR, and 'H...
Label the significant peaks in the IR and NMR spectra. When analyzing the signals in the 'HNMR, b...
 Label the significant peaks in the IR and NMR spectra. When analyzing the signals in the 'HNMR, be sure to include all appropriate information. For example: 3H, singlet, 0 neighbors, and c (the letter referring to the corresponding unique type of hydrogens that were labeled in the structure). It is recommended to provide more analysis for each signal than what is described above, when necessary, such as labeling any coupling constants if any are provided For NMR label each peak...
please fill out the tables for the HNMR graph and the IR graph. bottlobo Dobrodelno ondul...
 please fill out the tables for the HNMR graph and the IR graph.
bottlobo Dobrodelno ondul to holublot bobod bo to -0.10 -0.05 - -0.00 de controlo od 7.5 7.0 6.5 6.0 floom 5.5 5.0 4.5 4.0 Figure 1: 'H NMR of Methyl benzoate The original file is uploaded on Canvas (Modules section, Spectral Data for Labs folder) CHEM 344 Modern Organic Chemistry Laboratory 1H NMR Analysis Table: Draw the structure of methyl benzoate and label the protons. Fill out...
please fill out the tables for the HNMR graph and the IR graph.
bottlobo Dobrodelno ondul to holublot bobod bo to -0.10 -0.05 - -0.00 de controlo od 7.5 7.0 6.5 6.0 floom 5.5 5.0 4.5 4.0 Figure 1: 'H NMR of Methyl benzoate The original file is uploaded on Canvas (Modules section, Spectral Data for Labs folder) CHEM 344 Modern Organic Chemistry Laboratory 1H NMR Analysis Table: Draw the structure of methyl benzoate and label the protons. Fill out...
Please use the spectroscopic data for butyl acetate to answer the following questions. 1. The molecularion...
 Please use the spectroscopic data for butyl acetate to answer the following questions. 1. The molecularion of butyl acetate is unstable, and does not show in the mass spectrum. - The base peak in the mass spectrum is an ion with m/z = 43, which corresponds to an ion with an atomic composition of C2H30+: lonization i n lonization in CH0- C2H30* butyl acetate a positively charged radical m/z=43 gmentation (Loss of a butoxy radical) Draw a structure for this...
General Note: If a printer is not accessible, the problem set may be completed on regular...
 General Note: If a printer is not accessible, the problem set may be completed on regular paper, but please ensure all answers are clear. Notations for IR and NMR may be written out and listed by wavenumbers and ppm, respectively. if this is the case or provided space is insufficient 1. (3 points) For the structure and 'H NMR spectrum shown below, match the labeled hydrogen atoms on the molecule (A-D) with the corresponding signals in the spectrum using the...
PART 2 Draw the most accurate 'H-NMR spectrum you can for the following molecules. Show all...
 PART 2 Draw the most accurate 'H-NMR spectrum you can for the following molecules. Show all signals including an accurate representation of splitting, intensity and position. Assume no signal overlap (i.e. if you expect signals have similar chemical shifts, just place them next to each other). Clearly label the integration value for each signal. Indicate the correlation between each proton (HA, HB, etc) and each signal (label signals A, B, etc.) ppm 12.5 10 11 O ppm 12.5 10 ii...
thank you in advance Label the significant peaks in the IR and NMR spectra. When analyzing...
 thank you in advance
Label the significant peaks in the IR and NMR spectra. When analyzing the signals in the 'H NMR, be sure to include all appropriate information. For example: 3H, singlet, 0 neighbors, and c (the letter referring to the corresponding unique type of hydrogens that were labeled in the structure). It is recommended to provide more analysis for each signal than what is described above, when necessary, such as labeling any coupling constants if any are provided....
thank you in advance
Label the significant peaks in the IR and NMR spectra. When analyzing the signals in the 'H NMR, be sure to include all appropriate information. For example: 3H, singlet, 0 neighbors, and c (the letter referring to the corresponding unique type of hydrogens that were labeled in the structure). It is recommended to provide more analysis for each signal than what is described above, when necessary, such as labeling any coupling constants if any are provided....
Uute! I. Concept Areer the following questions (25 pts) Poe 1. 10 pts) In a Boeyervilleger...
 Uute! I. Concept Areer the following questions (25 pts) Poe 1. 10 pts) In a Boeyervilleger reaction ketones (R.CO) are converted to esters (COR) by using DRONY acids. With an unanimetrical ketone, two possible esters can be formed for 3,3-dimethyl-2-butanone as storting material. What are those? How could you use spectroscopic techniques: IH NMR, IR and MS to determine which enter is formed 2) Page 1. 5 pts) Drow and compare the structures of ethylene, acetylene, and benzer. Each of...
 can
i please get help on identifying my unknown and answering the
questions for each part. and please explain because i will be given
an exam like this and want to really understand.
n 122240 2019 (GMT-04 00h 94 92 90 88 86 84 82 80 78 76 74 72 70 68 66 64 1000 1500 2000 2500 3000 3500 4000 Wavenumbers (cm-1) Date: Tue Jun 11 12:22:40 2019 (GMT-04:00kaoutar elbar Scans: 8 Resolution: 4.000 onemea1% RH 003 Q1L 129...
can
i please get help on identifying my unknown and answering the
questions for each part. and please explain because i will be given
an exam like this and want to really understand.
n 122240 2019 (GMT-04 00h 94 92 90 88 86 84 82 80 78 76 74 72 70 68 66 64 1000 1500 2000 2500 3000 3500 4000 Wavenumbers (cm-1) Date: Tue Jun 11 12:22:40 2019 (GMT-04:00kaoutar elbar Scans: 8 Resolution: 4.000 onemea1% RH 003 Q1L 129...
 need help figuring the unknown and starting these
questions.
Identify the important (diagnostic) peaks from the IR spectrum. corresponds to each peak below. Be sure to also add labels your IR spectrum (write the corresponding bond type next to each peak on the IR spectrum itself) 2. List the cm 1 and the bond that 3. List all possible classes of compounds that your unknown could be (i.e. could the unknown be a ketone, alcohol, ester, carboxylic acid? does the...
need help figuring the unknown and starting these
questions.
Identify the important (diagnostic) peaks from the IR spectrum. corresponds to each peak below. Be sure to also add labels your IR spectrum (write the corresponding bond type next to each peak on the IR spectrum itself) 2. List the cm 1 and the bond that 3. List all possible classes of compounds that your unknown could be (i.e. could the unknown be a ketone, alcohol, ester, carboxylic acid? does the...
 Unknown H415 100 50 1000 1S00 2000 3000 BRVENUMBERI 4000 Unknown H415 ЗН 1 H-N 2H, q 1H, d 5H, m 1H, d 0 1 2 3 6 7 8 10 11 ppm HSP-00-049 Unknown H415 q 140 120 100 200 180 160 ppm CDS-00-726 20 -40 60 80 Relative Intensity 09 Unknown H415 100 MS-NJ-0442 80 20 thmpt 25 50 75 100 125 150 175 m/z Date: Name: Section/Group: Instructor: Report Sheet: Laboratory 14 MS,IR, 13C NMR, and 'H...
 Label the significant peaks in the IR and NMR spectra. When analyzing the signals in the 'HNMR, be sure to include all appropriate information. For example: 3H, singlet, 0 neighbors, and c (the letter referring to the corresponding unique type of hydrogens that were labeled in the structure). It is recommended to provide more analysis for each signal than what is described above, when necessary, such as labeling any coupling constants if any are provided For NMR label each peak...
 please fill out the tables for the HNMR graph and the IR graph.
bottlobo Dobrodelno ondul to holublot bobod bo to -0.10 -0.05 - -0.00 de controlo od 7.5 7.0 6.5 6.0 floom 5.5 5.0 4.5 4.0 Figure 1: 'H NMR of Methyl benzoate The original file is uploaded on Canvas (Modules section, Spectral Data for Labs folder) CHEM 344 Modern Organic Chemistry Laboratory 1H NMR Analysis Table: Draw the structure of methyl benzoate and label the protons. Fill out...
please fill out the tables for the HNMR graph and the IR graph.
bottlobo Dobrodelno ondul to holublot bobod bo to -0.10 -0.05 - -0.00 de controlo od 7.5 7.0 6.5 6.0 floom 5.5 5.0 4.5 4.0 Figure 1: 'H NMR of Methyl benzoate The original file is uploaded on Canvas (Modules section, Spectral Data for Labs folder) CHEM 344 Modern Organic Chemistry Laboratory 1H NMR Analysis Table: Draw the structure of methyl benzoate and label the protons. Fill out...
 Please use the spectroscopic data for butyl acetate to answer the following questions. 1. The molecularion of butyl acetate is unstable, and does not show in the mass spectrum. - The base peak in the mass spectrum is an ion with m/z = 43, which corresponds to an ion with an atomic composition of C2H30+: lonization i n lonization in CH0- C2H30* butyl acetate a positively charged radical m/z=43 gmentation (Loss of a butoxy radical) Draw a structure for this...
 General Note: If a printer is not accessible, the problem set may be completed on regular paper, but please ensure all answers are clear. Notations for IR and NMR may be written out and listed by wavenumbers and ppm, respectively. if this is the case or provided space is insufficient 1. (3 points) For the structure and 'H NMR spectrum shown below, match the labeled hydrogen atoms on the molecule (A-D) with the corresponding signals in the spectrum using the...
 PART 2 Draw the most accurate 'H-NMR spectrum you can for the following molecules. Show all signals including an accurate representation of splitting, intensity and position. Assume no signal overlap (i.e. if you expect signals have similar chemical shifts, just place them next to each other). Clearly label the integration value for each signal. Indicate the correlation between each proton (HA, HB, etc) and each signal (label signals A, B, etc.) ppm 12.5 10 11 O ppm 12.5 10 ii...
 thank you in advance
Label the significant peaks in the IR and NMR spectra. When analyzing the signals in the 'H NMR, be sure to include all appropriate information. For example: 3H, singlet, 0 neighbors, and c (the letter referring to the corresponding unique type of hydrogens that were labeled in the structure). It is recommended to provide more analysis for each signal than what is described above, when necessary, such as labeling any coupling constants if any are provided....
thank you in advance
Label the significant peaks in the IR and NMR spectra. When analyzing the signals in the 'H NMR, be sure to include all appropriate information. For example: 3H, singlet, 0 neighbors, and c (the letter referring to the corresponding unique type of hydrogens that were labeled in the structure). It is recommended to provide more analysis for each signal than what is described above, when necessary, such as labeling any coupling constants if any are provided....
 Uute! I. Concept Areer the following questions (25 pts) Poe 1. 10 pts) In a Boeyervilleger reaction ketones (R.CO) are converted to esters (COR) by using DRONY acids. With an unanimetrical ketone, two possible esters can be formed for 3,3-dimethyl-2-butanone as storting material. What are those? How could you use spectroscopic techniques: IH NMR, IR and MS to determine which enter is formed 2) Page 1. 5 pts) Drow and compare the structures of ethylene, acetylene, and benzer. Each of...
Most questions answered within 3 hours.
-
simplify the following boolean expression using boolean
identities(A' means NOT A):
X=(AB'C')+(AB'C)+(ABC)
asked 4 minutes ago -
2. What is the structure of tricaprylmethylammonium chloride?
What property or properties allow it to act...
asked 6 minutes ago -
A sample of 24 observations is selected from a normal population
where the sample standard deviation...
asked 18 minutes ago -
How social media will be used in education in 2030?? Actually i
am working on an...
asked 20 minutes ago -
Using Horner's scheme, represent (evaluate) the 2's complement
number 10011101 in decimal.
CAUTION: You will earn...
asked 22 minutes ago -
The vapor pressure of ethanol at 34.7 degrees Celsius is
100mmHg, and Hvap= 38.6 kJ/mol. What...
asked 24 minutes ago -
#3
Given the following hypotheses:
H0: μ = 520
H1: μ ≠ 520
A random sample...
asked 37 minutes ago -
You have been given a stipend to expand your “troubleshooting
tool kit” by adding three additional...
asked 32 minutes ago -
A machine costs P320,000 with a scrap value of 10% of the
original price at the...
asked 34 minutes ago -
Suppose that you have a reflection diffraction grating with n=
140 lines per millimeter. Light from...
asked 37 minutes ago -
A physician at a large clinic sees clients of all ages: babies
(<2 years old, event...
asked 41 minutes ago -
Find the indicated area under the standard normal curve. To the
right of zequals 1.16Find the...
asked 41 minutes ago