As part of a study designed to compare hybrid and similarly equipped conventional vehicles, Consumer Reports...
As part of a study designed to compare hybrid and similarly equipped conventional vehicles, Consumer Reports tested a variety of classes of hybrid and all-gas model cars and sport utility vehicles (SUVs). The following data show the miles-per-gallon rating Consumer Reports obtained for two hybrid small cars, two hybrid midsize cars, two hybrid small SUVs, and two hybrid midsize SUVs; also shown are the miles per gallon obtained for eight similarly equipped conventional models. Dataset: CarModels
- What are the treatment(s) and how many are there?
- What is the number of observations in each treatment and the total number of observations?
- Create a table with the marginal means of this factorial design. Draw an interaction plot.
- Are there any interactions between the factors? Why?
- Set up an ANOVA Table. Do the proper tests.
- Is it necessary to continue? Explain. Even if not, still answer next question.
- Test for differences in means for Factor A and Factor B.
Make/Model Class Type MPG Honda Civic Small Car Hybrid 37 Honda Civic Small Car Conventional 28 Toyota Prius Small Car Hybrid 44 Toyota Corolla Small Car Conventional 32 Chevrolet Malibu Midsize Car Hybrid 27 Chevrolet Malibu Midsize Car Conventional 23 Nissan Altima Midsize Car Hybrid 32 Nissan Altima Midsize Car Conventional 25 Ford Escape Small SUV Hybrid 27 Ford Escape Small SUV Conventional 21 Saturn Vue Small SUV Hybrid 28 Saturn Vue Small SUV Conventional 22 Lexus RX Midsize SUV Hybrid 23 Lexus RX Midsize SUV Conventional 19 Toyota Highlander Midsize SUV Hybrid 24 Toyota Highlander Midsize SUV Conventional 18
Homework Answers

there are total 2*2*4 = 16 observation
there are 2 factors
4 levels for class and 2 levels for Type

Using Excel
data -> data analysis -> Anova: Two-Factor With ReplicationANOVA
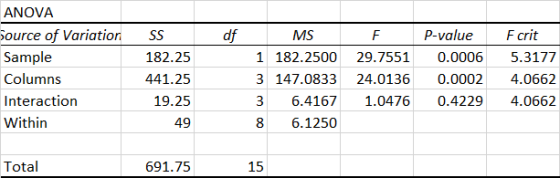
The p-value for Factor A is less than .01
Factor A is significant
The p-value for Factor B is less than .01,
Factor B is significant
The p-value for the interaction of factors A and B is greater than .10
The interaction of factors A and B is not significant
Add Answer to:
As part of a study designed to compare hybrid and similarly
equipped conventional vehicles, Consumer Reports...
As part of a study designed to compare hybrid and similarly equipped conventional vehicles, a group...
As part of a study designed to compare hybrid and similarly equipped conventional vehicles, a group tested a variety of classes of hybrid and all-gas model cars and sport utility vehicles (SUVs). Suppose the following data show the miles-per-gallon rating obtained for two hybrid small cars, two hybrid midsize cars, two hybrid small SUVs, and two hybrid midsize SUVs; also shown are the miles per gallon obtained for eight similarly equipped convention Class Type MPG Small Car Hybrid 37 Small...
NAME: 1.24 It is a commonly held belief that SUVs are safer than cars. If an...
 NAME: 1.24 It is a commonly held belief that SUVs are safer than cars. If an SUV and car are in a collision, does the SUV sustain less damage (as suggested by the cost of repair)? The Insurance Institute for Highway Safety crashed SUVs into cars, with the SUV moving 10 mph and the front of the SUV crashing into the rear or the car. The following data was obtained: (40 PTS) SUV into Car SUV Damage (S) Car Damage...
Car engine displacement in liters and fuel consumption for combined city/highway in miles per gallon (MPG)....
Car engine displacement in liters and fuel consumption for combined city/highway in miles per gallon (MPG). This data is from 2015 Fuel Economy Guide for the Department of Energy (DOE) Engine a. Make a scatterplot of the car MPG by displacement from the data in columns B and C. Displacement Combined Be sure the scatterplot contains the 5 important points of a chart or graph. Car Liters MPG Acura RLX 3.5 22.0 b. Place the regression trend line on the...
The Buyer's Guide of the Web site for Car and Driver magazine provides reviews and road tests for...
 The Buyer's Guide of the Web site for Car and Driver magazine provides reviews and road tests for cars, trucks, SUVs, and Vans. The average ratings of overall quality, vehicle styling, braking, handling, fuel economy, interior comfort, acceleration, dependability, fit and finish, transmission, and ride are summarized for each vehicle using a scale ranging from 1 (worst) to 10 (best). A portion of the data for a number of Sports/GT cars is shown as follows: Overall qualityHandlingFit and Finish Dependability...
 NAME: 1.24 It is a commonly held belief that SUVs are safer than cars. If an SUV and car are in a collision, does the SUV sustain less damage (as suggested by the cost of repair)? The Insurance Institute for Highway Safety crashed SUVs into cars, with the SUV moving 10 mph and the front of the SUV crashing into the rear or the car. The following data was obtained: (40 PTS) SUV into Car SUV Damage (S) Car Damage...
 The Buyer's Guide of the Web site for Car and Driver magazine provides reviews and road tests for cars, trucks, SUVs, and Vans. The average ratings of overall quality, vehicle styling, braking, handling, fuel economy, interior comfort, acceleration, dependability, fit and finish, transmission, and ride are summarized for each vehicle using a scale ranging from 1 (worst) to 10 (best). A portion of the data for a number of Sports/GT cars is shown as follows: Overall qualityHandlingFit and Finish Dependability...
Most questions answered within 3 hours.
-
Cynaide is a deadly poison that blocks the last step in the
electron transport chain of...
asked 1 minute from now -
Your friend tells you that there is a vending machine on campus
that dispenses M&M packs...
asked 14 minutes ago -
What advantages are there to using piperidine rather than
hydroxide as a base?
asked 12 minutes ago -
7. The life of a Freeze Breeze electric fan is normally
distributed with a mean 4...
asked 15 minutes ago -
1. A 751 mL NaCl solution is diluted to a volume of 1.06 L and a...
asked 20 minutes ago -
8
A $20,000 face value STRIPS is currently quoted at 38.642 and
has 8 years to...
asked 20 minutes ago -
The current exchange rate between the Japanese yen and
the US dollar is 120 yen per...
asked 22 minutes ago -
Marla’s Massages and More bought a special massage table two
years ago for $9,300. At the...
asked 29 minutes ago -
Suppose you require a peak output voltage of 15.0 V and have
available an AC source...
asked 30 minutes ago -
We
conduct A study to estimate the mean age of the population of women
at the...
asked 41 minutes ago -
.13 : Assume that we make an enhancement to a computer that
improves some mode of...
asked 43 minutes ago -
4)
Find the tension in an elevator cable if the 1000 kg elevator is
descending with...
asked 49 minutes ago