
Homework Answers
a )
There is no data given in the question , hence i shall simulate some and show how to run the analysis in excel
The hypothesis can be constructed as
H0 : There is no evidence at 0.05 level that the population
moisture content is less than 0.35
H1 : There is signficant evidence at 0.05 level that the population
moisture content is less than 0.35
as we are interested in less than 0.35 , hence please note that this becomes a 1 sided left tail test


c) Even for Vermont shingles the procedure remains the same
just replace boston shinles data with vermont shingles
For boston shingles
as we see that the critical value is 1.689 which is not less than -1.48 , hence we fail to reject the null hypothesis and conclude that the result is not signficant and conclude that
There is no evidence at 0.05 level that the population moisture content is less than 0.35
For vermont shingles
as we see that the critical value is 1.695 which is not less than -3.15, hence we fail to reject the null hypothesis and conclude that the result is not signficant and conclude that
There is no evidence at 0.05 level that the population moisture content is less than 0.35
Add Answer to:
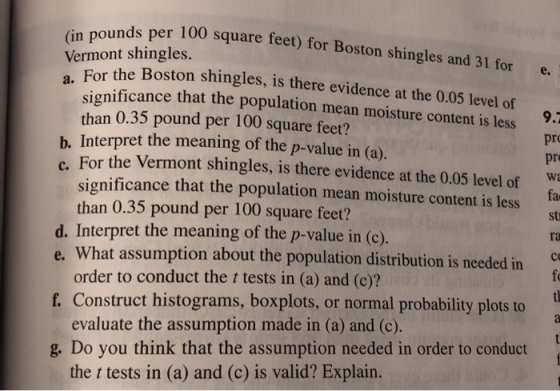
Just need letter A and C done. Thank you!!
9.76 An important quality characteristic used by...
Most questions answered within 3 hours.
-
Ripples in a pond travel at a velocity of 3 m/s with one peak
passing a...
asked 3 minutes ago -
A man stands on the roof of a building of height 13.0 mm and
throws a...
asked 9 minutes ago -
Based on the range, which of the following sets of scores has
the greatest variability? 3,...
asked 13 minutes ago -
The extent to which assets are financed by borrowed funds and
other liabilities is indicated by:...
asked 1 hour ago -
Explain in detail
Germany is the fifth largest economy
explain what goods and services Germany specializes...
asked 1 hour ago -
The density of platinum is 21.45 g/mL. If a cube of platinum
with a mass of...
asked 1 hour ago -
Accounts Receivable
Sales
A/R Posting
Extended Sales Invoice
Packing Slip
Compare invoice to packing slip 2...
asked 1 hour ago -
Michaella, age 23, is a full-time law student and is claimed by
her parents as a...
asked 1 hour ago -
Why are polymers not typically casted into products?
asked 1 hour ago -
When rolling a die 129 times, what is the probability of rolling
a 6 no more...
asked 2 hours ago -
4. A call option currently sells for $7.75. It has a strike
price of $85 and...
asked 1 hour ago -
1.
You need to prepare 10.0 liters of an acid aqueous solution with a
pH of...
asked 2 hours ago