Using the following production possibilities table for Cars and Guided Missiles answer the questions below: Type...
Using the following production possibilities table for
Cars and Guided Missiles
answer the questions below:
Type of
Product
A B C D E
Cars
(In millions)
0 2 4 6 8
Guided
Missiles
(In thousands)
30 27 21 12 0
(a) Graph the data in the table. Are there constant or increasing
costs for the
production of missiles? (2 marks)
(b) If the economy is currently at the point C:
What is the cost of one million more cars? (2 mark)
What is the cost of one thousand more guided missiles? (2
mark)
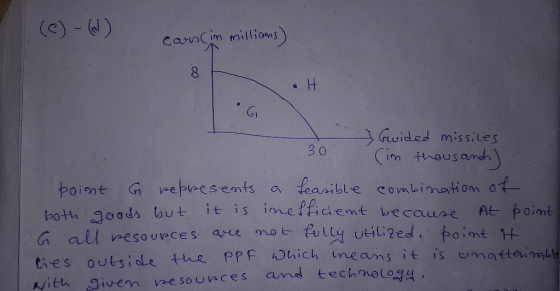
(c) Label a point G inside the curve of the graph for questions
(a). What doesit indicate? (2 marks)
(d) Label a point H that lies outside the production possibilities
curve of
question (2 marks)
What does this point indicate?
Homework Answers
A)

Suppose the economy is at point E, producing 8 millions car and 0 thousands guided missiles. Now if the economy moves from point E to point D, it produces 6 millions cars and 12 thousands guided missiles. It means opportunity cost of producing 1 thousand more guided missiles is [(8 - 6)/(12 - 0)] = 0.17 millions of cars. Now if the economy moves from point D to point C, it will produce 4 millions cars and 21 thousands guided missiles. Now, the opportunity cost of producing 1 thousand more guided missiles is [(6 - 4)/(21 - 12)] = 0.22 millions of cars.
It means opportunity cost of production of missiles is increasing.
B) If the economy is at point C, it is producing 4 millions cars and 21 thousands of guided missiles. Opportunity cost of one million more cars is [(21 - 12)/(6 - 4)] = 4.5 thousands of guided missiles.
Opportunity cost of one thousand more guided missiles is [(4 - 2)/(27 - 21)] = 0.33 million of cars.
(C) - (d)
Add Answer to:
Using the following production possibilities table for
Cars and Guided Missiles
answer the questions below:
Type...
urgent please Production Possibilities Analysis The table below is a set of hypothetical production possibilities for...
 urgent please
Production Possibilities Analysis The table below is a set of hypothetical production possibilities for a nation. . Automobiles Beef Combination (thousands) (thousands of tons) 10 4 0 9-4 10 a. Plot these production possibilities data. What is. the opportunity cost of the first 2,000 automobiles produced? Between which points is the oppor- tunity cost per thousand automobiles highest? Between which points is the opportunity cost per thousand tons of beef highest? b. Label a point P inside the...
urgent please
Production Possibilities Analysis The table below is a set of hypothetical production possibilities for a nation. . Automobiles Beef Combination (thousands) (thousands of tons) 10 4 0 9-4 10 a. Plot these production possibilities data. What is. the opportunity cost of the first 2,000 automobiles produced? Between which points is the oppor- tunity cost per thousand automobiles highest? Between which points is the opportunity cost per thousand tons of beef highest? b. Label a point P inside the...
Below is a production possibilities table for cars an corn in a small town. Good produced...
 Below is a production possibilities table for cars an corn in a small town. Good produced Cars Corn (tons) Production Alternatives А ТВ Тc TD 0 6 12 18 50 45 35 L 20 24 0 a. Graph a production possibilities curve/frontier for this town. b. Does this PPF demonstrate the law of increasing opportunity costs? Why or why not? C. If the economy is at point B, what is the opportunity cost of producing 6 more cars? What is...
4. Utilize the following table to construct a Production Possibilities Curve and answer the following questions:...
 4. Utilize the following table to construct a Production Possibilities Curve and answer the following questions: Assume you are a plastic goods manufacturer and specializing in making plastic canteens and frisbees, but cannot decide on what output to allocate your resources towards a. Construct a Production Possibilities Curve utilizing the table. (2 Points) b. What is the opportunity cost for the producer for moving from Point C on the graph to point D? (3 Points) c. Due to it being...
Use the following to answer questions 40-42: Table: The Production Possibilities for Tractors and Crude Oil...
 Use the following to answer questions 40-42: Table: The Production Possibilities for Tractors and Crude Oil Crude oil Country Tractors (thousands of barrels) United States 80 40 Mexico 60 180 40. Look at the table The Production Possibilities for Tractors and Crude Oil. In Mexico the opportunity cost of producing one tractor is thousand barrels of crude oil. A) 3 B) 1/2 C) 2 D) 3/4 E) 1/3 41. Look at the table The Production Possibilities for Tractors and Crude...
In the following table of production possibilities of X and Y: Production Possibilities A B C...
In the following table of production possibilities of X and Y: Production Possibilities A B C D X 18 12 6 0 Y 0 12 24 48 ANSWER THE FOLLOWING QUESTIONS BASED ON THE ABOVE TABLE. WRITE YOUR ANSWERS TO THE NEAREST TWO DECIMAL DIGITS. A) If the economy is at point C, what is the opportunity cost (in absolute value) of producing one more unit of X? Answer for part 1 B) What is the opportunity cost (in absolute...
#2 shirt? 2.) The following table shows several points on a small economy's production possibilities boundary...
 #2
shirt? 2.) The following table shows several points on a small economy's production possibilities boundary Production of Coffee (in tons) Production of Cars (in thousands) 115 95 70 40 Point (a) [1 point] Starting from point B, what is the opportunity cost of producing 2,000 more cars? (b) [1 point] Starting from point D, what is the opportunity cost of producing 2,000 more cars?
#2
shirt? 2.) The following table shows several points on a small economy's production possibilities boundary Production of Coffee (in tons) Production of Cars (in thousands) 115 95 70 40 Point (a) [1 point] Starting from point B, what is the opportunity cost of producing 2,000 more cars? (b) [1 point] Starting from point D, what is the opportunity cost of producing 2,000 more cars?
1. Table: Production Possibilities for the United States and Canada One Possibility U.S. Production Possibilities Another...
 1. Table: Production Possibilities for the United States and Canada One Possibility U.S. Production Possibilities Another Possibility Quantity of Cars (millions) Quantity of Lumber (millions of board feet) 10 0 10 Canada Production Possibilities One Possibility Another Possibility Quantity of Cars (millions) Quantity of Lumber (millions of board feet) 2 0 0 12 Reference: Ref 16-3 (Table: Production Possibilities for the United States and Canada) Examine the table Production Possibilities for the United States and Canada Both nations can produce...
1.4 Creating and Interpreting a Production Possibilities Curve Your task: using the data below, construct the...
 1.4 Creating and Interpreting a Production Possibilities Curve Your task: using the data below, construct the production possibilities curve for the hypothetical country of Michigania The country produces only two products: caps and balls (yes, they love sports in Michigania). Next, answer the questions that follow Production Possibility Number of caps (In milion) Number of balls (n millions 35 50 65 sO 68 54 35 You can draw this by hand, or you can use Word Art to label the...
2. The following are production possibilities tables for New Zealand and Spain. Answer the questions that...
 2. The following are production possibilities tables for New Zealand and Spain. Answer the questions that follow using the information in the tables. Although it is not necessary, you may find it beneficial to graph the tables in order to answer the questions. (26 points) New Zealand's Production Possibilities Table (Millions of Bushels) Product Production alternatives B 0 15 10 20 60 Apples Plums 5 Spain's Production Possibilities Table (Millions of Bushels) Product Production alternatives 20 Apples Plums 60 0...
Part 1 Below is a production possibilities table for consumer goods (butter) and capital goods (guns)....
Part 1 Below is a production possibilities table for consumer goods (butter) and capital goods (guns). Production Possibilities Type of Production Production Alternative A Production Alternative B Production Alternative C Production Alternative D Production Alternative E Production Alternative F Production Alternative G Butter 0 1 2 3 4 5 6 Guns 14 13 11 9 7 4 0 Graph the data provided in the table using Excel. (Hints: Type your data into an Excel spreadsheet. With your mouse, highlight the...
 urgent please
Production Possibilities Analysis The table below is a set of hypothetical production possibilities for a nation. . Automobiles Beef Combination (thousands) (thousands of tons) 10 4 0 9-4 10 a. Plot these production possibilities data. What is. the opportunity cost of the first 2,000 automobiles produced? Between which points is the oppor- tunity cost per thousand automobiles highest? Between which points is the opportunity cost per thousand tons of beef highest? b. Label a point P inside the...
urgent please
Production Possibilities Analysis The table below is a set of hypothetical production possibilities for a nation. . Automobiles Beef Combination (thousands) (thousands of tons) 10 4 0 9-4 10 a. Plot these production possibilities data. What is. the opportunity cost of the first 2,000 automobiles produced? Between which points is the oppor- tunity cost per thousand automobiles highest? Between which points is the opportunity cost per thousand tons of beef highest? b. Label a point P inside the...
 Below is a production possibilities table for cars an corn in a small town. Good produced Cars Corn (tons) Production Alternatives А ТВ Тc TD 0 6 12 18 50 45 35 L 20 24 0 a. Graph a production possibilities curve/frontier for this town. b. Does this PPF demonstrate the law of increasing opportunity costs? Why or why not? C. If the economy is at point B, what is the opportunity cost of producing 6 more cars? What is...
 4. Utilize the following table to construct a Production Possibilities Curve and answer the following questions: Assume you are a plastic goods manufacturer and specializing in making plastic canteens and frisbees, but cannot decide on what output to allocate your resources towards a. Construct a Production Possibilities Curve utilizing the table. (2 Points) b. What is the opportunity cost for the producer for moving from Point C on the graph to point D? (3 Points) c. Due to it being...
 Use the following to answer questions 40-42: Table: The Production Possibilities for Tractors and Crude Oil Crude oil Country Tractors (thousands of barrels) United States 80 40 Mexico 60 180 40. Look at the table The Production Possibilities for Tractors and Crude Oil. In Mexico the opportunity cost of producing one tractor is thousand barrels of crude oil. A) 3 B) 1/2 C) 2 D) 3/4 E) 1/3 41. Look at the table The Production Possibilities for Tractors and Crude...
 #2
shirt? 2.) The following table shows several points on a small economy's production possibilities boundary Production of Coffee (in tons) Production of Cars (in thousands) 115 95 70 40 Point (a) [1 point] Starting from point B, what is the opportunity cost of producing 2,000 more cars? (b) [1 point] Starting from point D, what is the opportunity cost of producing 2,000 more cars?
#2
shirt? 2.) The following table shows several points on a small economy's production possibilities boundary Production of Coffee (in tons) Production of Cars (in thousands) 115 95 70 40 Point (a) [1 point] Starting from point B, what is the opportunity cost of producing 2,000 more cars? (b) [1 point] Starting from point D, what is the opportunity cost of producing 2,000 more cars?
 1. Table: Production Possibilities for the United States and Canada One Possibility U.S. Production Possibilities Another Possibility Quantity of Cars (millions) Quantity of Lumber (millions of board feet) 10 0 10 Canada Production Possibilities One Possibility Another Possibility Quantity of Cars (millions) Quantity of Lumber (millions of board feet) 2 0 0 12 Reference: Ref 16-3 (Table: Production Possibilities for the United States and Canada) Examine the table Production Possibilities for the United States and Canada Both nations can produce...
 1.4 Creating and Interpreting a Production Possibilities Curve Your task: using the data below, construct the production possibilities curve for the hypothetical country of Michigania The country produces only two products: caps and balls (yes, they love sports in Michigania). Next, answer the questions that follow Production Possibility Number of caps (In milion) Number of balls (n millions 35 50 65 sO 68 54 35 You can draw this by hand, or you can use Word Art to label the...
 2. The following are production possibilities tables for New Zealand and Spain. Answer the questions that follow using the information in the tables. Although it is not necessary, you may find it beneficial to graph the tables in order to answer the questions. (26 points) New Zealand's Production Possibilities Table (Millions of Bushels) Product Production alternatives B 0 15 10 20 60 Apples Plums 5 Spain's Production Possibilities Table (Millions of Bushels) Product Production alternatives 20 Apples Plums 60 0...
Most questions answered within 3 hours.
-
20% of all customers subscribe to phone service.
70% of all customers subscribe to internet service....
asked 1 minute from now -
Write a program to solve the Josephus problem, with the following
modification:
Sample Input:
./a.out n...
asked 2 hours ago -
At the start of a CD it is spinning at a rate of 525 rpm
(revolutions...
asked 3 hours ago -
4. Without doing any calculations, predict whether the observed
∆T would increase, decrease or remain the...
asked 4 hours ago -
Based on the range, which of the following sets of scores has
the greatest variability? 3,...
asked 5 hours ago -
Ripples in a pond travel at a velocity of 3 m/s with one peak
passing a...
asked 5 hours ago -
A man stands on the roof of a building of height 13.0 mm and
throws a...
asked 5 hours ago -
The extent to which assets are financed by borrowed funds and
other liabilities is indicated by:...
asked 6 hours ago -
Explain in detail
Germany is the fifth largest economy
explain what goods and services Germany specializes...
asked 6 hours ago -
The density of platinum is 21.45 g/mL. If a cube of platinum
with a mass of...
asked 6 hours ago -
Accounts Receivable
Sales
A/R Posting
Extended Sales Invoice
Packing Slip
Compare invoice to packing slip 2...
asked 7 hours ago -
Michaella, age 23, is a full-time law student and is claimed by
her parents as a...
asked 7 hours ago