
I only need the r code. the dataset we have is a .csv file.
Homework Answers
import the data from the csv file with read.csv() function
then to plot the graph you shown, type the following commands in
R

I have posted a screenshot of the code is because it is easy to understand it with colors and alignment. I ll give you code as text below.
the idea is just plot graph of one variable first. then using lines() function you can plot remaining variable in the same graph. You will get the following graph.
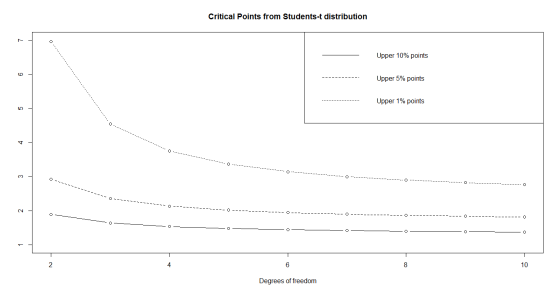
plot(x=tmat$df,y=tmat$t01,ylim=c(1,7),type="b",lty="dotted",
main="Critical Points from Students-t distribution",
xlab="Degrees of freedom",
ylab="")
lines(tmat$df,tmat$t05,type="b",lty="dashed")
lines(tmat$df,tmat$t10,type="b",lty="solid")
legend("topright",
legend=c("Upper 10% points",
"Upper 5% points",
"Upper 1% points"),
lty=c("solid","dashed","dotted"))
Add Answer to:
I only need the r code. the dataset we have is a .csv
file.
3. (10...
5. (20 pts) Suppose that we have a dataset {(yi, x, Tt2, X;3), i,1,... ,n} together with some general belief on the dat...
 5. (20 pts) Suppose that we have a dataset {(yi, x, Tt2, X;3), i,1,... ,n} together with some general belief on the data that higher (lower) value of each covariate x; (j = 1,2,3) will tend to result in higher (lower) y. In this study, we are interested in predicting y; from the total set of the regressors x;i, X;2, xt3. So, we apply the multiple linear regression yi = Bo+B1x1 +B2x52 + B3x43 + t to the data and...
*has to with R program, I need the code for R script* I already have questions...
 *has to with R program, I need the code for R script*
I already have questions 1 through solved and posted a picture
of them. I need help with questions 4-11 please!!! thank u
4 plots a histogram showing the distribution of your X. 5 generates a data series Y with a length equal to 'howmany' 6 plots the distribution Y 7 assigns the series X to a new variable Z. 8 calculates the variance of the series Z using...
*has to with R program, I need the code for R script*
I already have questions 1 through solved and posted a picture
of them. I need help with questions 4-11 please!!! thank u
4 plots a histogram showing the distribution of your X. 5 generates a data series Y with a length equal to 'howmany' 6 plots the distribution Y 7 assigns the series X to a new variable Z. 8 calculates the variance of the series Z using...
I need help with Part e. I have already constructed the histogram using R and Rstudio (picture below). I am just confused about the empirical rule and locating the data points on the intervals. If a...
 I need help with Part e. I have already constructed the
histogram using R and Rstudio (picture below). I am just confused
about the empirical rule and locating the data points on the
intervals. If anyone could assist me, I'd appreciate it greatly!
Thank you!
e radon concentration (in pCi/liter) data obtained from 40 houses in a 1.5.10. Th certain area are given below. 2.9 0.6 13.5 17.1 2.8 3.8 16.0 2.1 6.4 17.2 7.9 0.5 13.7 115 2.9 3.6...
I need help with Part e. I have already constructed the
histogram using R and Rstudio (picture below). I am just confused
about the empirical rule and locating the data points on the
intervals. If anyone could assist me, I'd appreciate it greatly!
Thank you!
e radon concentration (in pCi/liter) data obtained from 40 houses in a 1.5.10. Th certain area are given below. 2.9 0.6 13.5 17.1 2.8 3.8 16.0 2.1 6.4 17.2 7.9 0.5 13.7 115 2.9 3.6...
need help, work shown would be so helpful so i can understand and please box answer clearly if you can!!! either way thank you so much in advance:) s. You are interested in whether a treatment ca...
 need help, work shown would be so helpful so i can understand
and please box answer clearly if you can!!! either way thank you so
much in advance:)
s. You are interested in whether a treatment causes an effect on a continuously measurable attribute. You use a treatment group with 7 cases and a control group with 7 cases. You decide to run a hypothesis test with a significance level of 0.01. Your data is below. Please use 10 for...
need help, work shown would be so helpful so i can understand
and please box answer clearly if you can!!! either way thank you so
much in advance:)
s. You are interested in whether a treatment causes an effect on a continuously measurable attribute. You use a treatment group with 7 cases and a control group with 7 cases. You decide to run a hypothesis test with a significance level of 0.01. Your data is below. Please use 10 for...
For the following task, I have written code in C and need help in determining the...
 For the following task, I have written code in C and need help
in determining the cause(s) of a segmentation fault which occurs
when run.
**It prints the message on line 47 "printf("Reading the input
file and writing data to output file simultaneously..."); then
results in a segmentation fault (core dumped)
I am using mobaXterm v11.0 (GNU nano 2.0.9)
CSV (comma-separated values) is a popular file format to store
tabular kind of data. Each record is in a separate line...
For the following task, I have written code in C and need help
in determining the cause(s) of a segmentation fault which occurs
when run.
**It prints the message on line 47 "printf("Reading the input
file and writing data to output file simultaneously..."); then
results in a segmentation fault (core dumped)
I am using mobaXterm v11.0 (GNU nano 2.0.9)
CSV (comma-separated values) is a popular file format to store
tabular kind of data. Each record is in a separate line...
Open the "Lab Dataset" (HSCI390.sav) you have been using for lab assignments in SPSS. Your analysis...
 Open the "Lab Dataset"
(HSCI390.sav) you have been using for lab assignments in SPSS. Your
analysis will focus on the variables "Gender" (Gender) and "Blood
Alcohol Content at last drinking episode" (BAC).
Researchers are interested in examining if the mean Blood
Alcohol Content at last drinking episode differs between men and
women. To examine their research question of interest, they will
use data from the sample of CSUN students contained in the
HSCI390.sav dataset.
Using SPSS for the analysis, you...
Open the "Lab Dataset"
(HSCI390.sav) you have been using for lab assignments in SPSS. Your
analysis will focus on the variables "Gender" (Gender) and "Blood
Alcohol Content at last drinking episode" (BAC).
Researchers are interested in examining if the mean Blood
Alcohol Content at last drinking episode differs between men and
women. To examine their research question of interest, they will
use data from the sample of CSUN students contained in the
HSCI390.sav dataset.
Using SPSS for the analysis, you...
I need help with questions 1 through 2, thank you! The Esatina salamanders (Ensatina eschscholtzii), shown...
 I need help with questions 1 through 2, thank you!
The Esatina salamanders (Ensatina eschscholtzii), shown above, live along the West Coast of North America from Vancouver to Baja California. We will be focusing two populations: 1. individuals that live in Northern California and represent a more ancestral population 2. individuals that live in Southern California. Researchers have found that these all individuals of this salamander species have two color phenotype, either red or blotchy. Genetic analysis has shown that...
I need help with questions 1 through 2, thank you!
The Esatina salamanders (Ensatina eschscholtzii), shown above, live along the West Coast of North America from Vancouver to Baja California. We will be focusing two populations: 1. individuals that live in Northern California and represent a more ancestral population 2. individuals that live in Southern California. Researchers have found that these all individuals of this salamander species have two color phenotype, either red or blotchy. Genetic analysis has shown that...
I need help answering questions 9, 10. All work must be shown ( where needed) to...
 I need help answering questions 9, 10. All work must
be shown ( where needed) to receive credit
w 00 =7680 a 38 -1.2368 7. For the provided data set, find the first and third quartiles. 15 7 2 4 4 3 4 3 4 25 First quartile 61) 4 9 3 12 2 8 3 2 2 6 61=(nt)th 7 3 12 4 5 4 Increasing order ith Bersuation value 2222 333 334 -(6758th 0.) So "observation value 4...
I need help answering questions 9, 10. All work must
be shown ( where needed) to receive credit
w 00 =7680 a 38 -1.2368 7. For the provided data set, find the first and third quartiles. 15 7 2 4 4 3 4 3 4 25 First quartile 61) 4 9 3 12 2 8 3 2 2 6 61=(nt)th 7 3 12 4 5 4 Increasing order ith Bersuation value 2222 333 334 -(6758th 0.) So "observation value 4...
R studio #Exercise : Calculate the following probabilities : #1. Probability that a normal random variable...
R studio #Exercise : Calculate the following probabilities : #1. Probability that a normal random variable with mean 22 and variance 25 #(i)lies between 16.2 and 27.5 #(ii) is greater than 29 #(iii) is less than 17 #(iv)is less than 15 or greater than 25 #2.Probability that in 60 tosses of a fair coin the head comes up #(i) 20,25 or 30 times #(ii) less than 20 times #(iii) between 20 and 30 times #3.A random variable X has Poisson...
I do not know how make dot plots. I have the plots but do not know the code for R. Help me with t...
 I do not know how make dot plots. I have the plots but do not
know the code for R.
Help me with the code please
1. A dairy scientist is testing a new feed additive. She chooses 13 cows at random from a large population of cows. She randomly assigns mold 8 to get the old dict, and nnew-5 to get the new diet including the additive. The cows are housed in 13 separated pens and each gets separate...
I do not know how make dot plots. I have the plots but do not
know the code for R.
Help me with the code please
1. A dairy scientist is testing a new feed additive. She chooses 13 cows at random from a large population of cows. She randomly assigns mold 8 to get the old dict, and nnew-5 to get the new diet including the additive. The cows are housed in 13 separated pens and each gets separate...
 5. (20 pts) Suppose that we have a dataset {(yi, x, Tt2, X;3), i,1,... ,n} together with some general belief on the data that higher (lower) value of each covariate x; (j = 1,2,3) will tend to result in higher (lower) y. In this study, we are interested in predicting y; from the total set of the regressors x;i, X;2, xt3. So, we apply the multiple linear regression yi = Bo+B1x1 +B2x52 + B3x43 + t to the data and...
 *has to with R program, I need the code for R script*
I already have questions 1 through solved and posted a picture
of them. I need help with questions 4-11 please!!! thank u
4 plots a histogram showing the distribution of your X. 5 generates a data series Y with a length equal to 'howmany' 6 plots the distribution Y 7 assigns the series X to a new variable Z. 8 calculates the variance of the series Z using...
*has to with R program, I need the code for R script*
I already have questions 1 through solved and posted a picture
of them. I need help with questions 4-11 please!!! thank u
4 plots a histogram showing the distribution of your X. 5 generates a data series Y with a length equal to 'howmany' 6 plots the distribution Y 7 assigns the series X to a new variable Z. 8 calculates the variance of the series Z using...
 I need help with Part e. I have already constructed the
histogram using R and Rstudio (picture below). I am just confused
about the empirical rule and locating the data points on the
intervals. If anyone could assist me, I'd appreciate it greatly!
Thank you!
e radon concentration (in pCi/liter) data obtained from 40 houses in a 1.5.10. Th certain area are given below. 2.9 0.6 13.5 17.1 2.8 3.8 16.0 2.1 6.4 17.2 7.9 0.5 13.7 115 2.9 3.6...
I need help with Part e. I have already constructed the
histogram using R and Rstudio (picture below). I am just confused
about the empirical rule and locating the data points on the
intervals. If anyone could assist me, I'd appreciate it greatly!
Thank you!
e radon concentration (in pCi/liter) data obtained from 40 houses in a 1.5.10. Th certain area are given below. 2.9 0.6 13.5 17.1 2.8 3.8 16.0 2.1 6.4 17.2 7.9 0.5 13.7 115 2.9 3.6...
 need help, work shown would be so helpful so i can understand
and please box answer clearly if you can!!! either way thank you so
much in advance:)
s. You are interested in whether a treatment causes an effect on a continuously measurable attribute. You use a treatment group with 7 cases and a control group with 7 cases. You decide to run a hypothesis test with a significance level of 0.01. Your data is below. Please use 10 for...
need help, work shown would be so helpful so i can understand
and please box answer clearly if you can!!! either way thank you so
much in advance:)
s. You are interested in whether a treatment causes an effect on a continuously measurable attribute. You use a treatment group with 7 cases and a control group with 7 cases. You decide to run a hypothesis test with a significance level of 0.01. Your data is below. Please use 10 for...
 For the following task, I have written code in C and need help
in determining the cause(s) of a segmentation fault which occurs
when run.
**It prints the message on line 47 "printf("Reading the input
file and writing data to output file simultaneously..."); then
results in a segmentation fault (core dumped)
I am using mobaXterm v11.0 (GNU nano 2.0.9)
CSV (comma-separated values) is a popular file format to store
tabular kind of data. Each record is in a separate line...
For the following task, I have written code in C and need help
in determining the cause(s) of a segmentation fault which occurs
when run.
**It prints the message on line 47 "printf("Reading the input
file and writing data to output file simultaneously..."); then
results in a segmentation fault (core dumped)
I am using mobaXterm v11.0 (GNU nano 2.0.9)
CSV (comma-separated values) is a popular file format to store
tabular kind of data. Each record is in a separate line...
 Open the "Lab Dataset"
(HSCI390.sav) you have been using for lab assignments in SPSS. Your
analysis will focus on the variables "Gender" (Gender) and "Blood
Alcohol Content at last drinking episode" (BAC).
Researchers are interested in examining if the mean Blood
Alcohol Content at last drinking episode differs between men and
women. To examine their research question of interest, they will
use data from the sample of CSUN students contained in the
HSCI390.sav dataset.
Using SPSS for the analysis, you...
Open the "Lab Dataset"
(HSCI390.sav) you have been using for lab assignments in SPSS. Your
analysis will focus on the variables "Gender" (Gender) and "Blood
Alcohol Content at last drinking episode" (BAC).
Researchers are interested in examining if the mean Blood
Alcohol Content at last drinking episode differs between men and
women. To examine their research question of interest, they will
use data from the sample of CSUN students contained in the
HSCI390.sav dataset.
Using SPSS for the analysis, you...
 I need help with questions 1 through 2, thank you!
The Esatina salamanders (Ensatina eschscholtzii), shown above, live along the West Coast of North America from Vancouver to Baja California. We will be focusing two populations: 1. individuals that live in Northern California and represent a more ancestral population 2. individuals that live in Southern California. Researchers have found that these all individuals of this salamander species have two color phenotype, either red or blotchy. Genetic analysis has shown that...
I need help with questions 1 through 2, thank you!
The Esatina salamanders (Ensatina eschscholtzii), shown above, live along the West Coast of North America from Vancouver to Baja California. We will be focusing two populations: 1. individuals that live in Northern California and represent a more ancestral population 2. individuals that live in Southern California. Researchers have found that these all individuals of this salamander species have two color phenotype, either red or blotchy. Genetic analysis has shown that...
 I need help answering questions 9, 10. All work must
be shown ( where needed) to receive credit
w 00 =7680 a 38 -1.2368 7. For the provided data set, find the first and third quartiles. 15 7 2 4 4 3 4 3 4 25 First quartile 61) 4 9 3 12 2 8 3 2 2 6 61=(nt)th 7 3 12 4 5 4 Increasing order ith Bersuation value 2222 333 334 -(6758th 0.) So "observation value 4...
I need help answering questions 9, 10. All work must
be shown ( where needed) to receive credit
w 00 =7680 a 38 -1.2368 7. For the provided data set, find the first and third quartiles. 15 7 2 4 4 3 4 3 4 25 First quartile 61) 4 9 3 12 2 8 3 2 2 6 61=(nt)th 7 3 12 4 5 4 Increasing order ith Bersuation value 2222 333 334 -(6758th 0.) So "observation value 4...
 I do not know how make dot plots. I have the plots but do not
know the code for R.
Help me with the code please
1. A dairy scientist is testing a new feed additive. She chooses 13 cows at random from a large population of cows. She randomly assigns mold 8 to get the old dict, and nnew-5 to get the new diet including the additive. The cows are housed in 13 separated pens and each gets separate...
I do not know how make dot plots. I have the plots but do not
know the code for R.
Help me with the code please
1. A dairy scientist is testing a new feed additive. She chooses 13 cows at random from a large population of cows. She randomly assigns mold 8 to get the old dict, and nnew-5 to get the new diet including the additive. The cows are housed in 13 separated pens and each gets separate...
Most questions answered within 3 hours.
-
(63
#14)
which of the following statments best describes how chamging
the concentration of the substances...
asked 48 minutes ago -
In the following reaction, which element is undergoing
oxidation: Na2SO3 + N2O --> N2 + Na2SO4...
asked 1 hour ago -
Which of the following pairs of ions have the same electron
configuration?
I: Br− and Se2−...
asked 4 hours ago -
The Foremost Composite Materials Company is planning a two-day
sales conference for October 19-20. The conference...
asked 4 hours ago -
3) Illustrate the observed pattern of relatedness of organisms
versus adaptations to specific conditions. This means...
asked 4 hours ago -
In winter a lake has a 0.35 m thick ice layer over 1.10 m of
water....
asked 5 hours ago -
Assuming the following has been encrypted with a Vigenere cipher
below, use the method(s) and assumptions...
asked 6 hours ago -
How would I use switch statements to write a program that will
take an input of...
asked 6 hours ago -
Imagine a reaction in which methane gas combusts at a constant
pressure of 1 atm and...
asked 6 hours ago -
Two parallel wires (each 12 m in length) are separated by a
distance of 0.065 m...
asked 6 hours ago -
Suppose there were three masses at the corner of uniform
equilateral triangle. The masses are m1...
asked 6 hours ago -
Situation: A building that is 618 m above the ground floor. How
many times would a...
asked 6 hours ago