An article of the American Journal of Clinical Pathology, by Metz et al. (A-4) published the...
An article of the American Journal of Clinical Pathology, by Metz et al. (A-4) published the comparison of three methods to determine the percentage of dysmorphic erythrocytes in the urine. They obtained the following results when using the A (X) and B (Y) methods in 75 urine samples.
Draw a scatter diagram and obtain the regression equation and graph it on the diagram.
X Y X Y X Y X Y
0 0 20 16 65 55 89 81
0 1 16 18 66 71 90 80
0 11 17 30 67 70 91 90
2 0 19 30 69 71 90 97
5 0 20 29 74 60 92 89
6 3 18 35 75 59 93 98
7 3 25 32 73 70 93 97
9 5 30 40 75 69 94 98
8 6 32 45 76 70 95 89
9 7 39 49 78 80 95 95
10 15 40 50 78 82 95 97
10 17 48 41 77 90 95 98
13 13 47 43 82 73 97 85
15 8 57 42 85 74 98 95
18 7 50 60 85 80 99 95
19 9 60 65 86 75 100 96
20 9 60 70 88 74 100 100
16 13 59 69 88 83 100 99
19 16 62 70 88 91
Homework Answers
The regression equation of Y on X is given by
Y= 2.199 + 0.9503 X
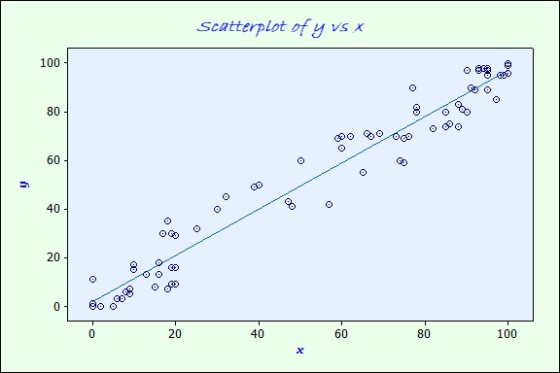
The blue line on the scatter plot represents the regression line .
n = 75; beta(0) = 2.199 beta(1)= 0.9503 ...least square estimates.
Add Answer to:
An article of the American Journal of Clinical Pathology, by
Metz et al. (A-4) published the...
1. Forecast demand for Year 4. a. Explain what technique you utilized to forecast your demand....
 1. Forecast demand for Year 4.
a. Explain what technique you utilized to forecast your
demand.
b. Explain why you chose this technique over others.
Year 3 Year 1 Year 2 Actual Actual Actual Forecast Forecast Forecast Demand Demand Demand Week 1 52 57 63 55 66 77 Week 2 49 58 68 69 75 65 Week 3 47 50 58 65 80 74 Week 4 60 53 58 55 78 67 57 Week 5 49 57 64 76 77...
1. Forecast demand for Year 4.
a. Explain what technique you utilized to forecast your
demand.
b. Explain why you chose this technique over others.
Year 3 Year 1 Year 2 Actual Actual Actual Forecast Forecast Forecast Demand Demand Demand Week 1 52 57 63 55 66 77 Week 2 49 58 68 69 75 65 Week 3 47 50 58 65 80 74 Week 4 60 53 58 55 78 67 57 Week 5 49 57 64 76 77...
Consider the below matrixA, which you can copy and paste directly into Matlab.
Problem #1: Consider the below matrix A, which you can copy and paste directly into Matlab. The matrix contains 3 columns. The first column consists of Test #1 marks, the second column is Test # 2 marks, and the third column is final exam marks for a large linear algebra course. Each row represents a particular student.A = [36 45 75 81 59 73 77 73 73 65 72 78 65 55 83 73 57 78 84 31 60 83...
Question 9-15 are based on the random sample below which is obtained to test the following hypoth...
Question 9-15 are based on the random sample below which is obtained to test the following hypothesis about the population mean. Test the hypothesis that the mean is less than 80. 80 100 81 93 80 57 98 90 71 56 58 78 59 55 55 77 72 78 56 94 98 59 93 86 89 62 60 66 59 71 96 97 94 69 64 77 87 77 64 90 90 95 98 99 56 69 72 81 95...
Use the Grouped Distribution method for the following exercise (see Self-Test 2-4 for detailed instructions), rounding...
Use the Grouped Distribution method for the following exercise (see Self-Test 2-4 for detailed instructions), rounding each answer to the nearest whole number. Using the frequency distribution below (scores on a statistics exam taken by 80 students), determine:ion 1 of the preliminary test (scores on a statistics exam taken by 80 students), determine: 68 84 75 82 68 90 62 88 76 93 73 79 88 73 60 93 71 59 85 75 61 65 75 87 74 62 95...
Midterm1 = (83.33, 98.33, 75, 91.67, 96.67, 95, 86.67, 65, 100, 100, 80, 88.33, 96.67, 96.67,...
 Midterm1 = (83.33, 98.33, 75, 91.67, 96.67, 95, 86.67, 65, 100,
100, 80, 88.33,
96.67, 96.67, 90, 96.67, 86.67, 93.33, 80, 91.67, 98.33, 86.67, 85,
86.67, 95,
83.33, 96.67, 81.67, 98.33, 100, 95, 93.33, 91.67, 88.33, 98.33,
93.33, 98.33,
93.33, 85, 88.33, 100, 98.33, 96.67, 90, 86.67, 100, 96.67, 98.33,
90, 96.67,
86.67, 95, 78.33, 86.67, 100, 81.67, 96.67, 91.67, 96.67, 96.67,
95, 96.67, 73.33,
100, 93.33, 96.67, 88.33, 70, 96.67, 96.67, 100, 88.33, 96.67, 100,
88.33, 100,
78.33, 93.33,...
Midterm1 = (83.33, 98.33, 75, 91.67, 96.67, 95, 86.67, 65, 100,
100, 80, 88.33,
96.67, 96.67, 90, 96.67, 86.67, 93.33, 80, 91.67, 98.33, 86.67, 85,
86.67, 95,
83.33, 96.67, 81.67, 98.33, 100, 95, 93.33, 91.67, 88.33, 98.33,
93.33, 98.33,
93.33, 85, 88.33, 100, 98.33, 96.67, 90, 86.67, 100, 96.67, 98.33,
90, 96.67,
86.67, 95, 78.33, 86.67, 100, 81.67, 96.67, 91.67, 96.67, 96.67,
95, 96.67, 73.33,
100, 93.33, 96.67, 88.33, 70, 96.67, 96.67, 100, 88.33, 96.67, 100,
88.33, 100,
78.33, 93.33,...
Write a python nested for loop that prints out the following pattern 100 99 98 97...
Write a python nested for loop that prints out the following pattern 100 99 98 97 96 95 94 93 92 91 90 89 88 87 86 85 84 83 82 81 80 79 78 77 76 75 74 73 72 71 70 69 68 67 66 65 64 63 62 61 60 59 58 57 56 55 54 53 52 51 50 49 48 47 46 45 44 43 42 41 40 39 38 37 36 35 34 33...
A teacher wanted to see if social anxiety affects performance on an oral assignment. To examine...
A teacher wanted to see if social anxiety affects performance on an oral assignment. To examine this, students completed social anxiety scales and were classified into “low,” “average,” and “high” levels of social anxiety. The data presented in the table below are the oral presentation grades (in percentages) earned by the 45 students separated by their social anxiety classification. Conduct the most appropriate statistical analysis to determine whether grades on the oral assignment differed based on level of social anxiety....
Please show how you did this in excel. :13-19 Every home football game for the past...
 Please show how you did this in excel.
:13-19 Every home football game for the past eight years at Eastern State University has been sold out. The revenues from ticket sales are significant, but the sale of food, beverages, and souvenirs has contrib- uted greatly to the overall profitability of the football program. One particular souvenir is the football pro- gram for each game. The number of programs sold at each game is described by the following probabil- ity distribution:...
Please show how you did this in excel.
:13-19 Every home football game for the past eight years at Eastern State University has been sold out. The revenues from ticket sales are significant, but the sale of food, beverages, and souvenirs has contrib- uted greatly to the overall profitability of the football program. One particular souvenir is the football pro- gram for each game. The number of programs sold at each game is described by the following probabil- ity distribution:...
Please help me with this program.You are to write a C++ program that will read in...
Please help me with this program.You are to write a C++ program that will read in up to 15 students with student information and grades. Your program will compute an average and print out certain reports. Format: The information for each student is on separate lines of input. The first data will be the student�s ID number, next line is the students name, next the students classification, and the last line are the 10 grades where the last grade is...
 1. Forecast demand for Year 4.
a. Explain what technique you utilized to forecast your
demand.
b. Explain why you chose this technique over others.
Year 3 Year 1 Year 2 Actual Actual Actual Forecast Forecast Forecast Demand Demand Demand Week 1 52 57 63 55 66 77 Week 2 49 58 68 69 75 65 Week 3 47 50 58 65 80 74 Week 4 60 53 58 55 78 67 57 Week 5 49 57 64 76 77...
1. Forecast demand for Year 4.
a. Explain what technique you utilized to forecast your
demand.
b. Explain why you chose this technique over others.
Year 3 Year 1 Year 2 Actual Actual Actual Forecast Forecast Forecast Demand Demand Demand Week 1 52 57 63 55 66 77 Week 2 49 58 68 69 75 65 Week 3 47 50 58 65 80 74 Week 4 60 53 58 55 78 67 57 Week 5 49 57 64 76 77...
 Midterm1 = (83.33, 98.33, 75, 91.67, 96.67, 95, 86.67, 65, 100,
100, 80, 88.33,
96.67, 96.67, 90, 96.67, 86.67, 93.33, 80, 91.67, 98.33, 86.67, 85,
86.67, 95,
83.33, 96.67, 81.67, 98.33, 100, 95, 93.33, 91.67, 88.33, 98.33,
93.33, 98.33,
93.33, 85, 88.33, 100, 98.33, 96.67, 90, 86.67, 100, 96.67, 98.33,
90, 96.67,
86.67, 95, 78.33, 86.67, 100, 81.67, 96.67, 91.67, 96.67, 96.67,
95, 96.67, 73.33,
100, 93.33, 96.67, 88.33, 70, 96.67, 96.67, 100, 88.33, 96.67, 100,
88.33, 100,
78.33, 93.33,...
Midterm1 = (83.33, 98.33, 75, 91.67, 96.67, 95, 86.67, 65, 100,
100, 80, 88.33,
96.67, 96.67, 90, 96.67, 86.67, 93.33, 80, 91.67, 98.33, 86.67, 85,
86.67, 95,
83.33, 96.67, 81.67, 98.33, 100, 95, 93.33, 91.67, 88.33, 98.33,
93.33, 98.33,
93.33, 85, 88.33, 100, 98.33, 96.67, 90, 86.67, 100, 96.67, 98.33,
90, 96.67,
86.67, 95, 78.33, 86.67, 100, 81.67, 96.67, 91.67, 96.67, 96.67,
95, 96.67, 73.33,
100, 93.33, 96.67, 88.33, 70, 96.67, 96.67, 100, 88.33, 96.67, 100,
88.33, 100,
78.33, 93.33,...
 Please show how you did this in excel.
:13-19 Every home football game for the past eight years at Eastern State University has been sold out. The revenues from ticket sales are significant, but the sale of food, beverages, and souvenirs has contrib- uted greatly to the overall profitability of the football program. One particular souvenir is the football pro- gram for each game. The number of programs sold at each game is described by the following probabil- ity distribution:...
Please show how you did this in excel.
:13-19 Every home football game for the past eight years at Eastern State University has been sold out. The revenues from ticket sales are significant, but the sale of food, beverages, and souvenirs has contrib- uted greatly to the overall profitability of the football program. One particular souvenir is the football pro- gram for each game. The number of programs sold at each game is described by the following probabil- ity distribution:...
Most questions answered within 3 hours.
-
The following results were obtained as
part of a multiple regression analysis involving 3 independent
variables:...
asked 22 minutes ago -
The time to complete a standardized exam is approximately normal
with a mean of 70 minutes...
asked 2 hours ago -
Two thousand randomly selected adults were asked whether or not
they have ever shopped on the...
asked 2 hours ago -
Estimate the diffusion coefficient for methyl phenyl sulfide in
water at 25 degrees Celcius.
asked 1 hour ago -
10.g of a certain metal absorb 40. cal of heat and the temperature
is abserved to...
asked 2 hours ago -
How many milliliters of 0.0695 M Ca( OH)
2would be required to exactly neutralize 176 mL...
asked 3 hours ago -
A telephone survey uses a random digit dialing machine to call
subjects. The random digit dialing...
asked 3 hours ago -
How can having too little or too much of a certain
protein cause problems for an...
asked 5 hours ago -
Assume a muscle has a PCSA = 20 cm2 and Lo = 12 cm. Assume it...
asked 6 hours ago -
What is the yield to maturity of a ten-year, $1,000 bond with a
5.2% coupon rate...
asked 7 hours ago -
A mass m = 5 kg is tied on one end of a rope and is...
asked 7 hours ago -
The Average sales price of single-family houses in Charlotte is
$210,000 with a standard deviation of...
asked 7 hours ago