This is for my younger sibling*** Select tools and techniques The double stem-and-leaf plot, where the...
This is for my younger sibling***
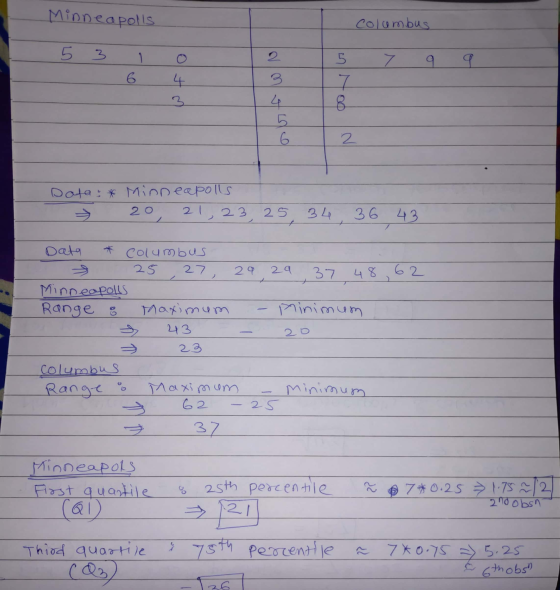
Select tools and techniques The double stem-and-leaf plot, where the stem is in the middle and the leaves are on either side, shows the high temperatures for two cities in the same week. Use the measures of spread to describe the data in the stem-and-leaf plot
| Minneapolis | Columbus | |
|---|---|---|
| 5 3 1 0 | 2 | 5 7 9 9 |
| 6 4 | 3 | 7 |
| 3 | 4 | 8 |
| 5 | ||
| 6 | 2 |
613=36° 215=25°
Homework Answers

Add Answer to:
This is for my younger sibling***
Select tools and techniques The double stem-and-leaf
plot, where the...
Construct a stem-and-leaf plot of the test scores 67, 73, 85, 75, 89, 89, 87, 90,...
 Construct a stem-and-leaf plot of the test scores 67, 73, 85, 75, 89, 89, 87, 90, 98, 100. How does the stem-and-leaf plot show the distribution of these data? Construct the stem-and-leaf plot. Choose the correct answer below OB. O c. Stem Leaves Stem Leaves Stem Leaves Stem Leaves 7 35 8 5799 9 0 8 10 0 7 35 8 5996 9 08 10 0 7 35 8 5997 9 07 10 0 7 36 8 5697 9 09...
Use a stem-and-leaf plot that has two rows for each stem to display the data, which...
Use a stem-and-leaf plot that has two rows for each stem to display the data, which represent the income (in millions) of 30 of the highest paid athletes. Describe any patterns. 37 36 44 50 35 55 56 65 45 63 46 37 76 45 34 44 43 81 53 38 73 34 38 87 34 53 41 42 45 58 Determine the leaves in the stem-and-leaf plot below. Key: 3|3equals33 Income ($ millions) 3 nothing 3 nothing 4 nothing...
The following stem-and-leaf plot represents the test scores for 22 students in a class on their...
The following stem-and-leaf plot represents the test scores for 22 students in a class on their most recent test. Use the data provided to find the quartiles. Test Scores by Student Stem Leaves 5 0 1 7 7 8 8 8 8 6 2 2 3 5 5 6 7 7 3 4 5 8 3 5 6 9 Key: 5||0=50 Step 1 of 3: Find the second quartile.
The following stem-and-leaf plot represents the prices in dollars of general admission tickets for the last...
 The following stem-and-leaf plot represents the prices in dollars of general admission tickets for the last 26 concerts at one venue. Use the data provided to find th quartiles. Ticket Prices in Dollars Stem Leaves 4 0 123 5 6 3 4 5 6 6 7 9 Key: 310 30 Copy Dat Step 2 of 3: Find the first quartile
Use a stem-and-leaf plot to display the data. The data represents the amount of hours employees...
Use a stem-and-leaf plot to display the data. The data represents the amount of hours employees at a certain company spend driving to and from work for a given month. What can you conclude about thedata? 3636 54 35 48 38 40 36 50 47 5151 4343 5353 2727 2525 6464 39 6262 41 3434 3737 Determine the leaves in the stem-and-leaf plot shown at the right. Stems Leaves 2 nothing 3 nothing 4 nothing 5 nothing (Key: 1 |...
The following stem-and-leaf plot represents the times in minutes required for 26 co-workers to commute to...
The following stem-and-leaf plot represents the times in minutes required for 26 co-workers to commute to work. Use the data provided to find the quartiles. Commute Times in Minutes Commute Times in Minutes Stem Leaves 1 0 4 4 6 6 6 9 2 2 4 4 5 8 3 3 4 4 5 6 8 4 0 0 3 3 5 6 7 8 Key: 1|0=10
Construct a stem-and-leaf plot of the test scores 67 comma 72 comma 85 comma 75 comma 89 comma 89 comma 88 comma 90 com...
Construct a stem-and-leaf plot of the test scores 67 comma 72 comma 85 comma 75 comma 89 comma 89 comma 88 comma 90 comma 98 comma 100.67, 72, 85, 75, 89, 89, 88, 90, 98, 100. How does the stem-and-leaf plot show the distribution of these data? Construct the stem-and-leaf plot. Choose the correct answer below. A. Stem Leaves 6 77 7 2 62 6 8 5 6 9 85 6 9 8 9 0 90 9 10 0 B....
Stem Stem The data in the accompanying stem-and-leaf plot summarizes the total deposits (in hundreds of...
 Stem Stem The data in the accompanying stem-and-leaf plot summarizes the total deposits (in hundreds of millions of dollars) for savings Institutions in a particular state. Answer parts (a) through (c) below. Leaves Leaves Stem Leaves 0 122344 2 5789 5 0 5677899 3 12 5 1 1123344 3 6 1 777 4 3 6 5 2. 4 77 Units: 65=$65 hundred million ($6.5 billion) شما (a) Describe the shape of the distribution. Choose the correct answer below. Left Skewed...
Stem and Leaf Plot of zresidual o o Leaf Digit Unit = 0.1 Minimum -0.8009 -O...
 Stem and Leaf Plot of zresidual o o Leaf Digit Unit = 0.1 Minimum -0.8009 -O 8 represents -0.8 Median -0.1863 Maximum 5.2919 Depth Stem Leaves 5 86655 (33) 0 444443333333332222211 11111110 12 0 001123334 3 7 2 2 2 2 2 2 2 3 2 3 9 1 4 1 4 1 5 2 1 1 50 cases included O missing cases 13. Is the normal assumption for the random errors satisfied in your project? Why or why not?...
The stem and leaf plot below represents the amount of money Jill earned the past 10...
The stem and leaf plot below represents the amount of money Jill earned the past 10 weeks working at the restaurant. Where do values concentrate the most? stem leaf 12 0, 5, 8, 8 13 0, 1, 2, 4, 6, 7, 9 14 1, 2, 3, 5, 5, 9 15 16 5 Question 6 options: A) $140s B) $120s C) $160s D) $130s
 Construct a stem-and-leaf plot of the test scores 67, 73, 85, 75, 89, 89, 87, 90, 98, 100. How does the stem-and-leaf plot show the distribution of these data? Construct the stem-and-leaf plot. Choose the correct answer below OB. O c. Stem Leaves Stem Leaves Stem Leaves Stem Leaves 7 35 8 5799 9 0 8 10 0 7 35 8 5996 9 08 10 0 7 35 8 5997 9 07 10 0 7 36 8 5697 9 09...
 The following stem-and-leaf plot represents the prices in dollars of general admission tickets for the last 26 concerts at one venue. Use the data provided to find th quartiles. Ticket Prices in Dollars Stem Leaves 4 0 123 5 6 3 4 5 6 6 7 9 Key: 310 30 Copy Dat Step 2 of 3: Find the first quartile
 Stem Stem The data in the accompanying stem-and-leaf plot summarizes the total deposits (in hundreds of millions of dollars) for savings Institutions in a particular state. Answer parts (a) through (c) below. Leaves Leaves Stem Leaves 0 122344 2 5789 5 0 5677899 3 12 5 1 1123344 3 6 1 777 4 3 6 5 2. 4 77 Units: 65=$65 hundred million ($6.5 billion) شما (a) Describe the shape of the distribution. Choose the correct answer below. Left Skewed...
 Stem and Leaf Plot of zresidual o o Leaf Digit Unit = 0.1 Minimum -0.8009 -O 8 represents -0.8 Median -0.1863 Maximum 5.2919 Depth Stem Leaves 5 86655 (33) 0 444443333333332222211 11111110 12 0 001123334 3 7 2 2 2 2 2 2 2 3 2 3 9 1 4 1 4 1 5 2 1 1 50 cases included O missing cases 13. Is the normal assumption for the random errors satisfied in your project? Why or why not?...
Most questions answered within 3 hours.
-
91. If the half – life of a sample of radioactive
material is 60 days, what...
asked 1 minute ago -
White light (380nm-750nm) strikes a diffraction grating (420
lines/mm) at normal incidence. What is the highest-order...
asked 11 minutes ago -
1) Explain what is meant by a good being "excludable."?
2) Explain what is meant by...
asked 10 minutes ago -
I need help with this question:
Describe in detail at least two factors that stimulated American...
asked 18 minutes ago -
Calculate the Boyle temperature for helium assuming it follows
the Berthelot equation of state.
asked 18 minutes ago -
Summarize Strategic Corporate Social Responsibility, 4th edition
2017 book, chapter one and two.
asked 18 minutes ago -
1. If the standard deviations for return on stock A and stock B
are 28% and...
asked 33 minutes ago -
Please use python to explain.
Assume that the variables x and
y refer to strings. Write...
asked 40 minutes ago -
This table shows the US domestic demand and supply schedules
for oranges. Suppose the world price...
asked 40 minutes ago -
Please help me create a CLASS DIAGRAM for this code:
import pygame
from pygame.sprite import Sprite...
asked 41 minutes ago -
The Merriweather Printing Company is trying to decide on the
merits of constructing a new publishing...
asked 1 hour ago -
29) Insulin is a water-soluble hormone transported in the blood.
Which describes a likely way in...
asked 1 hour ago