In the Cooling Tea Activity example, the function appears to
level off. Please Explain why this happens.
Homework Answers
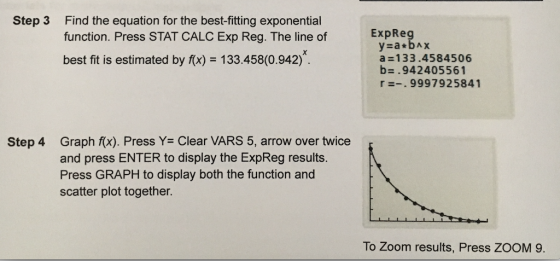
we get best fit estimated by f(x)=133.458(0.942)^x
This is exponential funtion and this is the way of plotting
exponential function when x values is high it will level off.
to check this you can put


as these f(x) values are too small it appear to level off
.....................................
if you have any doubt ask in comment give thumbs up if you like work.
Add Answer to:
In the Cooling Tea Activity example, the function appears to
level off. Please Explain why this...
I really need your help to answer this question for Tables 1 - 5. Thank you...
 I really need your help to answer this question for Tables 1 -
5. Thank you so much I appreciate it!!!
For each set of values, determine whether an exponential
function is a good model. If so, find the function. If not, explain
why.
Part C-Linear and Exponential Models (possible 15 points) You can transform an exponential function into a linear function by taking the logarithm of each side. Since linear models are easy to recognize, you can then determine...
I really need your help to answer this question for Tables 1 -
5. Thank you so much I appreciate it!!!
For each set of values, determine whether an exponential
function is a good model. If so, find the function. If not, explain
why.
Part C-Linear and Exponential Models (possible 15 points) You can transform an exponential function into a linear function by taking the logarithm of each side. Since linear models are easy to recognize, you can then determine...
Please help me, my professor wants us to explain step by step each problem but I...
 Please help me, my professor wants us to explain step by step each
problem but I cant! This is worth many points so please help me!
Thank you!
Writing Assignment 4 The following application and statements a., b., d., e., and f. can be found Sullivan's PreCalculus 9t www wennnnm edition pages 336-337. "A strain of E-coli SC18del-recA718 is placed into a nutrient broth at 30° Celsius and allowed to grow. The data given below are collected where x is...
Please help me, my professor wants us to explain step by step each
problem but I cant! This is worth many points so please help me!
Thank you!
Writing Assignment 4 The following application and statements a., b., d., e., and f. can be found Sullivan's PreCalculus 9t www wennnnm edition pages 336-337. "A strain of E-coli SC18del-recA718 is placed into a nutrient broth at 30° Celsius and allowed to grow. The data given below are collected where x is...
Writing Assignment 4 The following application and statements a., b., d., e., and f. can be found...
 Writing Assignment 4 The following application and statements a., b., d., e., and f. can be found Sullivan's Precalculus 9th edition pages 336-337. "A strain of E-coli SC18del-recA718 is placed into a nutrient broth at 30° Celsius and allowed to grow. The data given below are collected where x is for time in hours and y is for population. The theory states that the number of bacteria in the petri dish will initially grow according to the law of uninhibited...
*Please show work TIA:-) Date: Name: Storm Tracker Portfolio Worksheet PRECALCULUS: PARAMETRIC FUNCTIONS Directions: Meteorologists use sophisticated models to predict the occurrence, duration,...
 *Please show work TIA:-)
Date: Name: Storm Tracker Portfolio Worksheet PRECALCULUS: PARAMETRIC FUNCTIONS Directions: Meteorologists use sophisticated models to predict the occurrence, duration, and trajectory of weather events. They build their models based on observations that they have made in the past. By understanding how previous weather events evolved, meteooogists can apply that knowledge to future weather Parametric equations can be used to graph the path of an object in space. For example, used to describe the path of a...
*Please show work TIA:-)
Date: Name: Storm Tracker Portfolio Worksheet PRECALCULUS: PARAMETRIC FUNCTIONS Directions: Meteorologists use sophisticated models to predict the occurrence, duration, and trajectory of weather events. They build their models based on observations that they have made in the past. By understanding how previous weather events evolved, meteooogists can apply that knowledge to future weather Parametric equations can be used to graph the path of an object in space. For example, used to describe the path of a...
I need help to write a nice introduction for experiment 6 please ( no hands write ) typing Thank you HEAT TREATMENT OF STEELS EXPERIMENT 6 EXPERIMENT 6 HEAT TREATMENT OF STEELS THEORY The Ef...
 I need help to write a nice introduction for experiment 6
please ( no hands write ) typing
Thank you
HEAT TREATMENT OF STEELS EXPERIMENT 6 EXPERIMENT 6 HEAT TREATMENT OF STEELS THEORY The Effect of Cooling Rate One of the most convenient methods for controlling the properties of a given steel, i.e., a steel whose composition is already fixed, consists of austenizing the steel and ten cooling to room temperature at some predetermined rate. A variation of cooling rates...
I need help to write a nice introduction for experiment 6
please ( no hands write ) typing
Thank you
HEAT TREATMENT OF STEELS EXPERIMENT 6 EXPERIMENT 6 HEAT TREATMENT OF STEELS THEORY The Effect of Cooling Rate One of the most convenient methods for controlling the properties of a given steel, i.e., a steel whose composition is already fixed, consists of austenizing the steel and ten cooling to room temperature at some predetermined rate. A variation of cooling rates...
 I really need your help to answer this question for Tables 1 -
5. Thank you so much I appreciate it!!!
For each set of values, determine whether an exponential
function is a good model. If so, find the function. If not, explain
why.
Part C-Linear and Exponential Models (possible 15 points) You can transform an exponential function into a linear function by taking the logarithm of each side. Since linear models are easy to recognize, you can then determine...
I really need your help to answer this question for Tables 1 -
5. Thank you so much I appreciate it!!!
For each set of values, determine whether an exponential
function is a good model. If so, find the function. If not, explain
why.
Part C-Linear and Exponential Models (possible 15 points) You can transform an exponential function into a linear function by taking the logarithm of each side. Since linear models are easy to recognize, you can then determine...
 Please help me, my professor wants us to explain step by step each
problem but I cant! This is worth many points so please help me!
Thank you!
Writing Assignment 4 The following application and statements a., b., d., e., and f. can be found Sullivan's PreCalculus 9t www wennnnm edition pages 336-337. "A strain of E-coli SC18del-recA718 is placed into a nutrient broth at 30° Celsius and allowed to grow. The data given below are collected where x is...
Please help me, my professor wants us to explain step by step each
problem but I cant! This is worth many points so please help me!
Thank you!
Writing Assignment 4 The following application and statements a., b., d., e., and f. can be found Sullivan's PreCalculus 9t www wennnnm edition pages 336-337. "A strain of E-coli SC18del-recA718 is placed into a nutrient broth at 30° Celsius and allowed to grow. The data given below are collected where x is...
 Writing Assignment 4 The following application and statements a., b., d., e., and f. can be found Sullivan's Precalculus 9th edition pages 336-337. "A strain of E-coli SC18del-recA718 is placed into a nutrient broth at 30° Celsius and allowed to grow. The data given below are collected where x is for time in hours and y is for population. The theory states that the number of bacteria in the petri dish will initially grow according to the law of uninhibited...
 *Please show work TIA:-)
Date: Name: Storm Tracker Portfolio Worksheet PRECALCULUS: PARAMETRIC FUNCTIONS Directions: Meteorologists use sophisticated models to predict the occurrence, duration, and trajectory of weather events. They build their models based on observations that they have made in the past. By understanding how previous weather events evolved, meteooogists can apply that knowledge to future weather Parametric equations can be used to graph the path of an object in space. For example, used to describe the path of a...
*Please show work TIA:-)
Date: Name: Storm Tracker Portfolio Worksheet PRECALCULUS: PARAMETRIC FUNCTIONS Directions: Meteorologists use sophisticated models to predict the occurrence, duration, and trajectory of weather events. They build their models based on observations that they have made in the past. By understanding how previous weather events evolved, meteooogists can apply that knowledge to future weather Parametric equations can be used to graph the path of an object in space. For example, used to describe the path of a...
 I need help to write a nice introduction for experiment 6
please ( no hands write ) typing
Thank you
HEAT TREATMENT OF STEELS EXPERIMENT 6 EXPERIMENT 6 HEAT TREATMENT OF STEELS THEORY The Effect of Cooling Rate One of the most convenient methods for controlling the properties of a given steel, i.e., a steel whose composition is already fixed, consists of austenizing the steel and ten cooling to room temperature at some predetermined rate. A variation of cooling rates...
I need help to write a nice introduction for experiment 6
please ( no hands write ) typing
Thank you
HEAT TREATMENT OF STEELS EXPERIMENT 6 EXPERIMENT 6 HEAT TREATMENT OF STEELS THEORY The Effect of Cooling Rate One of the most convenient methods for controlling the properties of a given steel, i.e., a steel whose composition is already fixed, consists of austenizing the steel and ten cooling to room temperature at some predetermined rate. A variation of cooling rates...
Most questions answered within 3 hours.
-
Based on the range, which of the following sets of scores has
the greatest variability? 3,...
asked 1 hour ago -
Ripples in a pond travel at a velocity of 3 m/s with one peak
passing a...
asked 50 minutes ago -
A man stands on the roof of a building of height 13.0 mm and
throws a...
asked 56 minutes ago -
The extent to which assets are financed by borrowed funds and
other liabilities is indicated by:...
asked 1 hour ago -
Explain in detail
Germany is the fifth largest economy
explain what goods and services Germany specializes...
asked 2 hours ago -
The density of platinum is 21.45 g/mL. If a cube of platinum
with a mass of...
asked 2 hours ago -
Accounts Receivable
Sales
A/R Posting
Extended Sales Invoice
Packing Slip
Compare invoice to packing slip 2...
asked 2 hours ago -
Michaella, age 23, is a full-time law student and is claimed by
her parents as a...
asked 2 hours ago -
Why are polymers not typically casted into products?
asked 2 hours ago -
When rolling a die 129 times, what is the probability of rolling
a 6 no more...
asked 2 hours ago -
4. A call option currently sells for $7.75. It has a strike
price of $85 and...
asked 2 hours ago -
1.
You need to prepare 10.0 liters of an acid aqueous solution with a
pH of...
asked 2 hours ago