Please answer neatly and correctly! last one was answered wrong! and the critical value is at 0.01! please double check answer
Homework Answers
The statistic software output for this problem is:

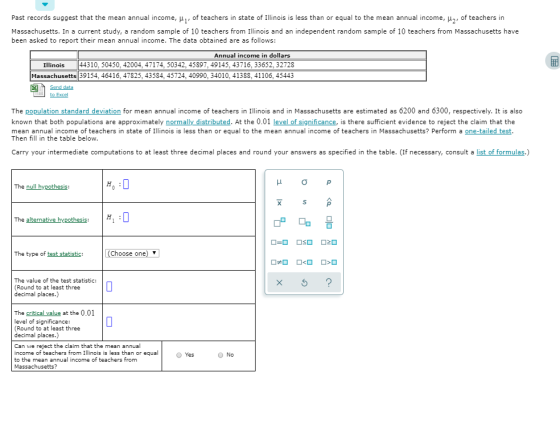
Null : H0 : μ1 - μ2 = 0
Alternative :HA : μ1 - μ2 > 0
The type of test : Z
Test statistics = 0.493
Critical value = 2.326
No
Add Answer to:
Please answer neatly and correctly! last one was answered wrong!
and the critical value is at...
Past records suggest that the mean annual income, μ 1, of teachers in state of New York is less t...
 Past records suggest that the mean annual income, μ 1, of teachers in state of New York is less than or equal to the mean annual income, μ of teachers in Illinois. In a current study, a random sample of 10 teachers from New York and an independent random sample of 10 teachers from Illinois have been asked to report their mean annual income. The data obtained are as follows: Annual income in dollars New York 38021, 49809, 38147, 43028,...
Past records suggest that the mean annual income, Hy, of teachers in state of California is...
 Past records suggest that the mean annual income, Hy, of teachers in state of California is less than or equal to the mean annual income, Hy, of teachers in Oregon. In a current study, a random sample of 10 teachers from California and an independent random sample of 10 teachers from Oregon have been asked to report their mean annual income. The data obtained are as follows: Annual income in dollars California 43096,44370,53093, 52462, 41185, 49592, 41491, 45798,43632, 48322 Oregon...
Past records suggest that the mean annual income, Hy, of teachers in state of California is...
 Past records suggest that the mean annual income, Hy, of teachers in state of California is less than or equal to the mean annual income, My, of teachers in Oregon. In a current study, a random sample of 10 teachers from California and an independent random sample of 10 teachers from Oregon have been asked to report their mean annual income. The data obtained are as follows: Annual income in dollars California 43096, 44370, 53093, 52462, 41185,49592,41491, 45798,43632, 48322 Oregon...
Past records suggest that the mean annual income, 12, of teachers in state of Georgia is...
 Past records suggest that the mean annual income, 12, of teachers in state of Georgia is greater than or equal to the mean annual income, H2, of teachers in Indiana. In a current study, a random sample of 15 teachers from Georgia and an independent random sample of 15 teachers from Indiana have been asked to report their mean annual income. The data obtained are as follows. Annual income in dollars Georgia 35563, 41690, 51807, 41824, 35509, 35642, 31758, 46318,...
answer neatly and correctly please! A recent study at a local college claimed that the proportion,...
 answer neatly and correctly
please!
A recent study at a local college claimed that the proportion, p, of students who commute more than fifteen miles to school is no more than 20%. If a random sample of 270 students at this college is selected, and it is found that 58 commute more than fifteen miles to school, can we reject the college's claim at the 0.05 level of significance? Perform a one-tailed test. Then fill in the table below. Carry...
answer neatly and correctly
please!
A recent study at a local college claimed that the proportion, p, of students who commute more than fifteen miles to school is no more than 20%. If a random sample of 270 students at this college is selected, and it is found that 58 commute more than fifteen miles to school, can we reject the college's claim at the 0.05 level of significance? Perform a one-tailed test. Then fill in the table below. Carry...
Past records suggest that the mean annual income, μ 1 , of teachers in state of Arizona is greater than or equal to the mean annual income, μ 2 , of teachers in Nevada. In a current study, a random sa...
Past records suggest that the mean annual income, μ 1 , of teachers in state of Arizona is greater than or equal to the mean annual income, μ 2 , of teachers in Nevada. In a current study, a random sample of 25 teachers from Arizona and an independent random sample of 25 teachers from Nevada have been asked to report their mean annual income.The data obtained are as follows. Annual income in dollars Arizona 45264, 32766, 36547, 37402, 38579,...
answer neatly and correctly please! A rental agent claims that the mean monthly rent, u, for...
 answer neatly and correctly
please!
A rental agent claims that the mean monthly rent, u, for apartments on the east side of town is less than $675. A random sample of 12 monthly rents for apartments on the east side has a mean of $670, with a standard deviation of $15. If we assume that the monthly rents for apartments on the east side are normally distributed, is there enough evidence to conclude, at the 0.05 level of significance, that...
answer neatly and correctly
please!
A rental agent claims that the mean monthly rent, u, for apartments on the east side of town is less than $675. A random sample of 12 monthly rents for apartments on the east side has a mean of $670, with a standard deviation of $15. If we assume that the monthly rents for apartments on the east side are normally distributed, is there enough evidence to conclude, at the 0.05 level of significance, that...
answer neatly and correctly please! The breaking strengths of cables produced by a certain manufacturer have...
 answer neatly and correctly
please!
The breaking strengths of cables produced by a certain manufacturer have a mean, u, of 1850 pounds, and a standard deviation of 55 pounds. It is claimed that an improvement in the manufacturing process has increased the mean breaking strength. To evaluate this claim, 70 newly manufactured cables are randomly chosen and tested, and their mean breaking strength is found to be 1868 pounds. Can we support, at the 0.01 level of significance, the claim...
answer neatly and correctly
please!
The breaking strengths of cables produced by a certain manufacturer have a mean, u, of 1850 pounds, and a standard deviation of 55 pounds. It is claimed that an improvement in the manufacturing process has increased the mean breaking strength. To evaluate this claim, 70 newly manufactured cables are randomly chosen and tested, and their mean breaking strength is found to be 1868 pounds. Can we support, at the 0.01 level of significance, the claim...
For the folowing claim, find the null and alternative hypotheses, test statistic, critical value, and draw...
 For the folowing claim, find the null and alternative hypotheses, test statistic, critical value, and draw a conclusion. Assume that a simple random sample has been selected from a normally distributed population. Answer parts a-d. Claim: The mean IQ score of statistics professors is less than 119. Sample data: n 11, x 117, s 14. The significance level is ?-005 Click the icon to view a table of critical t-values. a. Choose the correct null hypothesis (Ho) and altenative hypothesis...
Please answer neatly and correctly! According to the historical data, the life expectancy in the United...
 Please answer neatly and correctly!
According to the historical data, the life expectancy in the United States is less than or equal to the life expectancy in Ireland. A new study has been made to see whether this has changed. Records of 290 individuals from the United States who died recently are selected at random. The 290 individuals lived an average of 77.8 years with a standard deviation of 7.8 years. Records of 205 individuals from Ireland who died recently...
Please answer neatly and correctly!
According to the historical data, the life expectancy in the United States is less than or equal to the life expectancy in Ireland. A new study has been made to see whether this has changed. Records of 290 individuals from the United States who died recently are selected at random. The 290 individuals lived an average of 77.8 years with a standard deviation of 7.8 years. Records of 205 individuals from Ireland who died recently...
 Past records suggest that the mean annual income, μ 1, of teachers in state of New York is less than or equal to the mean annual income, μ of teachers in Illinois. In a current study, a random sample of 10 teachers from New York and an independent random sample of 10 teachers from Illinois have been asked to report their mean annual income. The data obtained are as follows: Annual income in dollars New York 38021, 49809, 38147, 43028,...
 Past records suggest that the mean annual income, Hy, of teachers in state of California is less than or equal to the mean annual income, Hy, of teachers in Oregon. In a current study, a random sample of 10 teachers from California and an independent random sample of 10 teachers from Oregon have been asked to report their mean annual income. The data obtained are as follows: Annual income in dollars California 43096,44370,53093, 52462, 41185, 49592, 41491, 45798,43632, 48322 Oregon...
 Past records suggest that the mean annual income, Hy, of teachers in state of California is less than or equal to the mean annual income, My, of teachers in Oregon. In a current study, a random sample of 10 teachers from California and an independent random sample of 10 teachers from Oregon have been asked to report their mean annual income. The data obtained are as follows: Annual income in dollars California 43096, 44370, 53093, 52462, 41185,49592,41491, 45798,43632, 48322 Oregon...
 Past records suggest that the mean annual income, 12, of teachers in state of Georgia is greater than or equal to the mean annual income, H2, of teachers in Indiana. In a current study, a random sample of 15 teachers from Georgia and an independent random sample of 15 teachers from Indiana have been asked to report their mean annual income. The data obtained are as follows. Annual income in dollars Georgia 35563, 41690, 51807, 41824, 35509, 35642, 31758, 46318,...
 answer neatly and correctly
please!
A recent study at a local college claimed that the proportion, p, of students who commute more than fifteen miles to school is no more than 20%. If a random sample of 270 students at this college is selected, and it is found that 58 commute more than fifteen miles to school, can we reject the college's claim at the 0.05 level of significance? Perform a one-tailed test. Then fill in the table below. Carry...
answer neatly and correctly
please!
A recent study at a local college claimed that the proportion, p, of students who commute more than fifteen miles to school is no more than 20%. If a random sample of 270 students at this college is selected, and it is found that 58 commute more than fifteen miles to school, can we reject the college's claim at the 0.05 level of significance? Perform a one-tailed test. Then fill in the table below. Carry...
 answer neatly and correctly
please!
A rental agent claims that the mean monthly rent, u, for apartments on the east side of town is less than $675. A random sample of 12 monthly rents for apartments on the east side has a mean of $670, with a standard deviation of $15. If we assume that the monthly rents for apartments on the east side are normally distributed, is there enough evidence to conclude, at the 0.05 level of significance, that...
answer neatly and correctly
please!
A rental agent claims that the mean monthly rent, u, for apartments on the east side of town is less than $675. A random sample of 12 monthly rents for apartments on the east side has a mean of $670, with a standard deviation of $15. If we assume that the monthly rents for apartments on the east side are normally distributed, is there enough evidence to conclude, at the 0.05 level of significance, that...
 answer neatly and correctly
please!
The breaking strengths of cables produced by a certain manufacturer have a mean, u, of 1850 pounds, and a standard deviation of 55 pounds. It is claimed that an improvement in the manufacturing process has increased the mean breaking strength. To evaluate this claim, 70 newly manufactured cables are randomly chosen and tested, and their mean breaking strength is found to be 1868 pounds. Can we support, at the 0.01 level of significance, the claim...
answer neatly and correctly
please!
The breaking strengths of cables produced by a certain manufacturer have a mean, u, of 1850 pounds, and a standard deviation of 55 pounds. It is claimed that an improvement in the manufacturing process has increased the mean breaking strength. To evaluate this claim, 70 newly manufactured cables are randomly chosen and tested, and their mean breaking strength is found to be 1868 pounds. Can we support, at the 0.01 level of significance, the claim...
 For the folowing claim, find the null and alternative hypotheses, test statistic, critical value, and draw a conclusion. Assume that a simple random sample has been selected from a normally distributed population. Answer parts a-d. Claim: The mean IQ score of statistics professors is less than 119. Sample data: n 11, x 117, s 14. The significance level is ?-005 Click the icon to view a table of critical t-values. a. Choose the correct null hypothesis (Ho) and altenative hypothesis...
 Please answer neatly and correctly!
According to the historical data, the life expectancy in the United States is less than or equal to the life expectancy in Ireland. A new study has been made to see whether this has changed. Records of 290 individuals from the United States who died recently are selected at random. The 290 individuals lived an average of 77.8 years with a standard deviation of 7.8 years. Records of 205 individuals from Ireland who died recently...
Please answer neatly and correctly!
According to the historical data, the life expectancy in the United States is less than or equal to the life expectancy in Ireland. A new study has been made to see whether this has changed. Records of 290 individuals from the United States who died recently are selected at random. The 290 individuals lived an average of 77.8 years with a standard deviation of 7.8 years. Records of 205 individuals from Ireland who died recently...
Most questions answered within 3 hours.
-
The condensate from a steam distillation contains 12.0 g of
compound A and 18.0 g of...
asked 1 hour ago -
A major economic benefit of fixed exchange rates compared to
floating rates is that
a. the...
asked 2 hours ago -
1) For this reaction,
SiCl4 (l)+ 2H2O(g) <->
SiO2 (s) + 4HCl (g) DeltaH = -127 KJ...
asked 2 hours ago -
Which of the following does NOT add to US GDP? A. Saudi Arabia
buys fighter jets...
asked 3 hours ago -
2. Describe market equilibrium in terms of the following
characteristics
d.
How supply and demand interactions...
asked 3 hours ago -
1a. Create a class named Computer
- Separate declaration from implementation (i.e. Header and CPP
files)...
asked 3 hours ago -
A medical researcher
believes that a drug changes the body's temperature. Seven test
subjects are randomly...
asked 4 hours ago -
A call option on Project Cash Flow Consulting Inc.'s stock (PCF)
has a market price of...
asked 4 hours ago -
A study on the latest fad diet claimed that the amounts of
weight lost by all...
asked 4 hours ago -
give examples of how gene expression is inherited to the next
generation?
asked 4 hours ago -
If a project has _________ IRR(s), we should __________ . Assume
this project is competing with...
asked 4 hours ago -
In the figure, a sound of wavelength 0.700 m is emitted
isotropically by point source S....
asked 4 hours ago