
Homework Answers


Add Answer to:
please solve b and c
3. Use the following steps to sketch the graph of each...
i need help with c, d, and e 3. Use the following steps to sketch the...
 i
need help with c, d, and e
3. Use the following steps to sketch the graph of each of the following functions. Step 1: Find the domain. Step 2: Find the y-intercept and all x-intercepts. Step 3: Decide if the function has any symmetry: odd, even, periodic. Step 4: Find any horizontal or vertical asymptotes. Justify using limits. Step 5: Find the critical numbers and determine intervals of increase/decrease. Step 6: Identify all local extrema. State as ordered pairs....
i
need help with c, d, and e
3. Use the following steps to sketch the graph of each of the following functions. Step 1: Find the domain. Step 2: Find the y-intercept and all x-intercepts. Step 3: Decide if the function has any symmetry: odd, even, periodic. Step 4: Find any horizontal or vertical asymptotes. Justify using limits. Step 5: Find the critical numbers and determine intervals of increase/decrease. Step 6: Identify all local extrema. State as ordered pairs....
Please Show ALL Work 111. Use the guidelines to sketch the curve. 1. Find the domain...
 Please Show ALL Work
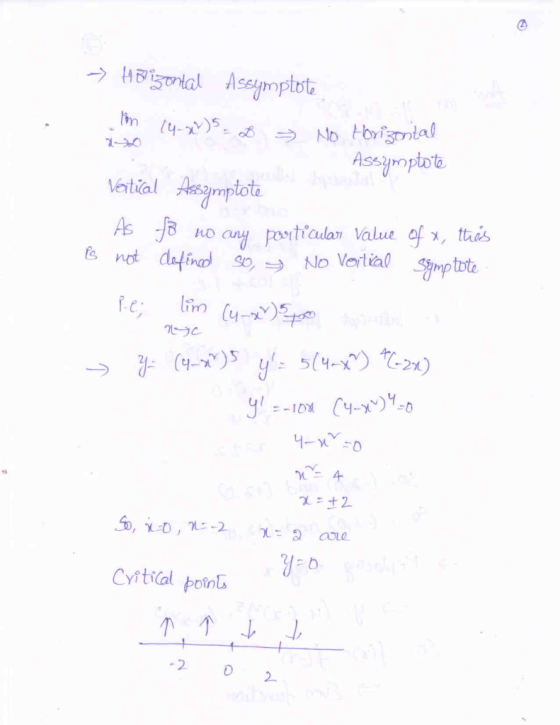
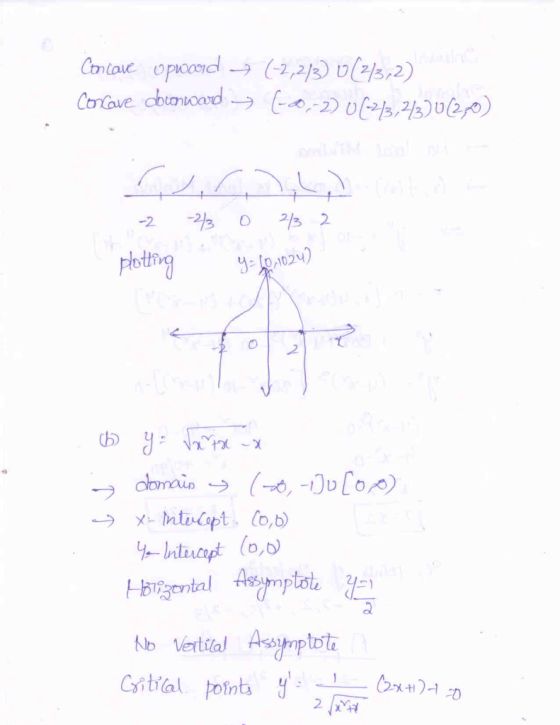
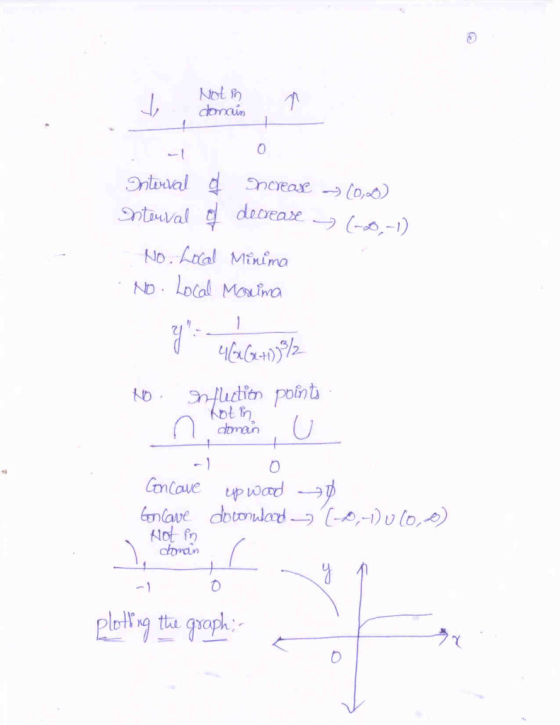
111. Use the guidelines to sketch the curve. 1. Find the domain 11. Find Intercepts Symmetry (Even or Odd Function) iv. Asymptotes V. Increasing/Decreasing Intervals vi. Local Extrema Concavity and Inflection Points viii. Sketch the Graph with all above information vii. b) y = 15-5%
Please Show ALL Work
111. Use the guidelines to sketch the curve. 1. Find the domain 11. Find Intercepts Symmetry (Even or Odd Function) iv. Asymptotes V. Increasing/Decreasing Intervals vi. Local Extrema Concavity and Inflection Points viii. Sketch the Graph with all above information vii. b) y = 15-5%
Use the steps below to sketch the graph y = x^2 - 7x - 18. Required...
Use the steps below to sketch the graph y = x^2 - 7x - 18. Required points are the x intercepts and the max and mix of the graph 1. Determine the domain of f. 2. Find the x- and y-intercepts of f.† 3. Determine the behavior of f for large absolute values of x. 4. Find all horizontal and vertical asymptotes of the graph of f. 5. Determine the intervals where f is increasing and where f is decreasing....
Show all of these steps to work this problem: ( - 5) ( 6) Domain Analyses...
 Show all of these steps to work this problem:
( - 5) ( 6) Domain Analyses Asymptotes: Vertical Horizontal Slant Intercepts х-int у-int Symmetry (Even/Odd) Continuity CALCULS Stuff 1st Derivative FDT Matrix Intervals Sign ot x) Interval Conclusion Extrema Conclusion (s) Differentiability Range 2nd Derivative SDT Matrix Intervals Sign of fx) Interval Conclusion Inflection Conclusion (s) Concavity Extrema using 2nd Derivative at 1st Derivative CPs
( - 5) ( 6)
Domain Analyses Asymptotes: Vertical Horizontal Slant Intercepts х-int у-int Symmetry...
Show all of these steps to work this problem:
( - 5) ( 6) Domain Analyses Asymptotes: Vertical Horizontal Slant Intercepts х-int у-int Symmetry (Even/Odd) Continuity CALCULS Stuff 1st Derivative FDT Matrix Intervals Sign ot x) Interval Conclusion Extrema Conclusion (s) Differentiability Range 2nd Derivative SDT Matrix Intervals Sign of fx) Interval Conclusion Inflection Conclusion (s) Concavity Extrema using 2nd Derivative at 1st Derivative CPs
( - 5) ( 6)
Domain Analyses Asymptotes: Vertical Horizontal Slant Intercepts х-int у-int Symmetry...
Show all of these steps to work this problem: 4x6 6r3 Domain Analyses Asymptotes: Vertical Horizontal...
 Show all of these steps to work this problem:
4x6 6r3 Domain Analyses Asymptotes: Vertical Horizontal Slant Intercepts х-int у-int Symmetry (Even/Odd) Continuity CALCULS Stuff 1st Derivative FDT Matrix Intervals Sign ot x) Interval Conclusion Extrema Conclusion (s) Differentiability Range 2nd Derivative SDT Matrix Intervals Sign of fx) Interval Conclusion Inflection Conclusion (s) Concavity Extrema using 2nd Derivative at 1st Derivative CPs
4x6 6r3
Domain Analyses Asymptotes: Vertical Horizontal Slant Intercepts х-int у-int Symmetry (Even/Odd) Continuity CALCULS Stuff 1st Derivative...
Show all of these steps to work this problem:
4x6 6r3 Domain Analyses Asymptotes: Vertical Horizontal Slant Intercepts х-int у-int Symmetry (Even/Odd) Continuity CALCULS Stuff 1st Derivative FDT Matrix Intervals Sign ot x) Interval Conclusion Extrema Conclusion (s) Differentiability Range 2nd Derivative SDT Matrix Intervals Sign of fx) Interval Conclusion Inflection Conclusion (s) Concavity Extrema using 2nd Derivative at 1st Derivative CPs
4x6 6r3
Domain Analyses Asymptotes: Vertical Horizontal Slant Intercepts х-int у-int Symmetry (Even/Odd) Continuity CALCULS Stuff 1st Derivative...
Analyze and sketch a graph of the function. Find any intercepts, relative extrema, points of inflection,...
 Analyze and sketch a graph of the function. Find any intercepts, relative extrema, points of inflection, and asymptotes. (If an answer does not exist, enter DNE.) x25 y= x2-64 intercept (x, y)- relative minimum (x, y)- relative maximum (x, y) point of inflection (x, y)- Find the equations of the asymptotes. (smaller x-value) (larger x-value) (horizontal asymptote) Use a graphing utility to verify your results. O 1/8 points Previous Answers LarCalc9 3.6.009. Analyze and sketch a graph of the function....
Analyze and sketch the graph of each function.
Analyze and sketch the graph of each function. Local intercepts, relative extrema, points of inflection and asymptotes. State for each problem the following: domain, range, intercepts, symmetry, asymptotes (horizontal and/or vertical asymptotes), critical numbers, points of inflection. a. \(Y=x^{2}+1 / x^{2}-9\)b. \(Y=x^{2} / x^{2}+3\)c. \(\mathrm{Y}=\frac{1}{3}\left(x^{2}-3 x+2\right)\)d. \(\mathrm{F}(\mathrm{x})=\frac{1}{x e^{x}}\)e. \(F(x)=x^{5}-5 x\)
A Guide to Curve Sketching 1. Determine the domain of f. 2. Find the x- and...
 A Guide to Curve Sketching 1. Determine the domain of f. 2. Find the x- and y-intercepts off.* 3. Determine the behavior of f for large absolute values of x. 4. Find all horizontal and vertical asymptotes of the graph of f. 5. Determine the intervals where f is increasing and where f is decreasing, 6. Find the relative extrema of f. 7. Determine the concavity of the graph of f. 8. Find the inflection points of f. 9. Plot...
For the function f(x) = -**-4x find the following, and use it to graph the function....
 For the function f(x) = -**-4x find the following, and use it to graph the function. Find: a) (2pts) Domain b)(2pts) Intercepts c)(2pts) Symmetry d) (2pts) Asymptotes e) 4pts) Intervals of Increase or decrease f) (2pts) Local maximum and local minimum values g)(4pts) Concavity and Points of inflection and h)(2pts) Sketch the curve
| Sketch the curve of the function f(x) = + unction f(x) = "* [r'(x) =...
 | Sketch the curve of the function f(x) = + unction f(x) = "* [r'(x) = 2*, S"(x) = 205*] Do this by determining the following information: domain, vertical asymptotes and limit - behavior, horizontal asymptotes, x \& y intercepts, symmetry, intervals of increase/decrease and maximum/minimum points, intervals of concavity and inflection points
 i
need help with c, d, and e
3. Use the following steps to sketch the graph of each of the following functions. Step 1: Find the domain. Step 2: Find the y-intercept and all x-intercepts. Step 3: Decide if the function has any symmetry: odd, even, periodic. Step 4: Find any horizontal or vertical asymptotes. Justify using limits. Step 5: Find the critical numbers and determine intervals of increase/decrease. Step 6: Identify all local extrema. State as ordered pairs....
i
need help with c, d, and e
3. Use the following steps to sketch the graph of each of the following functions. Step 1: Find the domain. Step 2: Find the y-intercept and all x-intercepts. Step 3: Decide if the function has any symmetry: odd, even, periodic. Step 4: Find any horizontal or vertical asymptotes. Justify using limits. Step 5: Find the critical numbers and determine intervals of increase/decrease. Step 6: Identify all local extrema. State as ordered pairs....
 Please Show ALL Work
111. Use the guidelines to sketch the curve. 1. Find the domain 11. Find Intercepts Symmetry (Even or Odd Function) iv. Asymptotes V. Increasing/Decreasing Intervals vi. Local Extrema Concavity and Inflection Points viii. Sketch the Graph with all above information vii. b) y = 15-5%
Please Show ALL Work
111. Use the guidelines to sketch the curve. 1. Find the domain 11. Find Intercepts Symmetry (Even or Odd Function) iv. Asymptotes V. Increasing/Decreasing Intervals vi. Local Extrema Concavity and Inflection Points viii. Sketch the Graph with all above information vii. b) y = 15-5%
 Show all of these steps to work this problem:
( - 5) ( 6) Domain Analyses Asymptotes: Vertical Horizontal Slant Intercepts х-int у-int Symmetry (Even/Odd) Continuity CALCULS Stuff 1st Derivative FDT Matrix Intervals Sign ot x) Interval Conclusion Extrema Conclusion (s) Differentiability Range 2nd Derivative SDT Matrix Intervals Sign of fx) Interval Conclusion Inflection Conclusion (s) Concavity Extrema using 2nd Derivative at 1st Derivative CPs
( - 5) ( 6)
Domain Analyses Asymptotes: Vertical Horizontal Slant Intercepts х-int у-int Symmetry...
Show all of these steps to work this problem:
( - 5) ( 6) Domain Analyses Asymptotes: Vertical Horizontal Slant Intercepts х-int у-int Symmetry (Even/Odd) Continuity CALCULS Stuff 1st Derivative FDT Matrix Intervals Sign ot x) Interval Conclusion Extrema Conclusion (s) Differentiability Range 2nd Derivative SDT Matrix Intervals Sign of fx) Interval Conclusion Inflection Conclusion (s) Concavity Extrema using 2nd Derivative at 1st Derivative CPs
( - 5) ( 6)
Domain Analyses Asymptotes: Vertical Horizontal Slant Intercepts х-int у-int Symmetry...
 Show all of these steps to work this problem:
4x6 6r3 Domain Analyses Asymptotes: Vertical Horizontal Slant Intercepts х-int у-int Symmetry (Even/Odd) Continuity CALCULS Stuff 1st Derivative FDT Matrix Intervals Sign ot x) Interval Conclusion Extrema Conclusion (s) Differentiability Range 2nd Derivative SDT Matrix Intervals Sign of fx) Interval Conclusion Inflection Conclusion (s) Concavity Extrema using 2nd Derivative at 1st Derivative CPs
4x6 6r3
Domain Analyses Asymptotes: Vertical Horizontal Slant Intercepts х-int у-int Symmetry (Even/Odd) Continuity CALCULS Stuff 1st Derivative...
Show all of these steps to work this problem:
4x6 6r3 Domain Analyses Asymptotes: Vertical Horizontal Slant Intercepts х-int у-int Symmetry (Even/Odd) Continuity CALCULS Stuff 1st Derivative FDT Matrix Intervals Sign ot x) Interval Conclusion Extrema Conclusion (s) Differentiability Range 2nd Derivative SDT Matrix Intervals Sign of fx) Interval Conclusion Inflection Conclusion (s) Concavity Extrema using 2nd Derivative at 1st Derivative CPs
4x6 6r3
Domain Analyses Asymptotes: Vertical Horizontal Slant Intercepts х-int у-int Symmetry (Even/Odd) Continuity CALCULS Stuff 1st Derivative...
 Analyze and sketch a graph of the function. Find any intercepts, relative extrema, points of inflection, and asymptotes. (If an answer does not exist, enter DNE.) x25 y= x2-64 intercept (x, y)- relative minimum (x, y)- relative maximum (x, y) point of inflection (x, y)- Find the equations of the asymptotes. (smaller x-value) (larger x-value) (horizontal asymptote) Use a graphing utility to verify your results. O 1/8 points Previous Answers LarCalc9 3.6.009. Analyze and sketch a graph of the function....
 A Guide to Curve Sketching 1. Determine the domain of f. 2. Find the x- and y-intercepts off.* 3. Determine the behavior of f for large absolute values of x. 4. Find all horizontal and vertical asymptotes of the graph of f. 5. Determine the intervals where f is increasing and where f is decreasing, 6. Find the relative extrema of f. 7. Determine the concavity of the graph of f. 8. Find the inflection points of f. 9. Plot...
 For the function f(x) = -**-4x find the following, and use it to graph the function. Find: a) (2pts) Domain b)(2pts) Intercepts c)(2pts) Symmetry d) (2pts) Asymptotes e) 4pts) Intervals of Increase or decrease f) (2pts) Local maximum and local minimum values g)(4pts) Concavity and Points of inflection and h)(2pts) Sketch the curve
 | Sketch the curve of the function f(x) = + unction f(x) = "* [r'(x) = 2*, S"(x) = 205*] Do this by determining the following information: domain, vertical asymptotes and limit - behavior, horizontal asymptotes, x \& y intercepts, symmetry, intervals of increase/decrease and maximum/minimum points, intervals of concavity and inflection points
Most questions answered within 3 hours.
-
2. Boris recently synthesized an explosive compound he named
Badenoughium. The molecular formula for Bdenoughium is...
asked 10 minutes ago -
5. A car decelerate evenly from a velocity of 50mph until rest
in a distance of...
asked 16 minutes ago -
IN HTML Programming
1. Write a script that inputs integers (one at a time) and
passes...
asked 30 minutes ago -
A dentist uses a mirror to examine a tooth that is 0.75 cm in
front of...
asked 29 minutes ago -
You set up a 100,000 line of credit for the business on 1/1/X8,
annual interest is...
asked 29 minutes ago -
What is the measurement uncertainty of a pan balance? How did you
get that?
asked 30 minutes ago -
Suppose four firms have market shares of 30%, 30%, 20% and 20%.
What is the Herfindahl-Hirschman...
asked 43 minutes ago -
IBT Industrial Solutions produces forty units of rack and pinion
type steering gears during an eight...
asked 41 minutes ago -
The Ksp for PbI2 is 9.8×10⁻⁹ . Will PbI2 precipitate if 2.5 mL
of 0.0025 M...
asked 44 minutes ago -
- Write a Person Constructor that initializes `name` and
`age` from arguments.
- All instances of...
asked 47 minutes ago -
What is the meaning of the statement: In acid-base catalysis,
acid catalysis involves partial proton transfer...
asked 55 minutes ago -
Polo Publishers purchased a multi-color offset press with terms
of $65,000 down and a noninterest-bearing note...
asked 53 minutes ago