Use the steps below to sketch the graph y = x^2 - 7x - 18. Required...
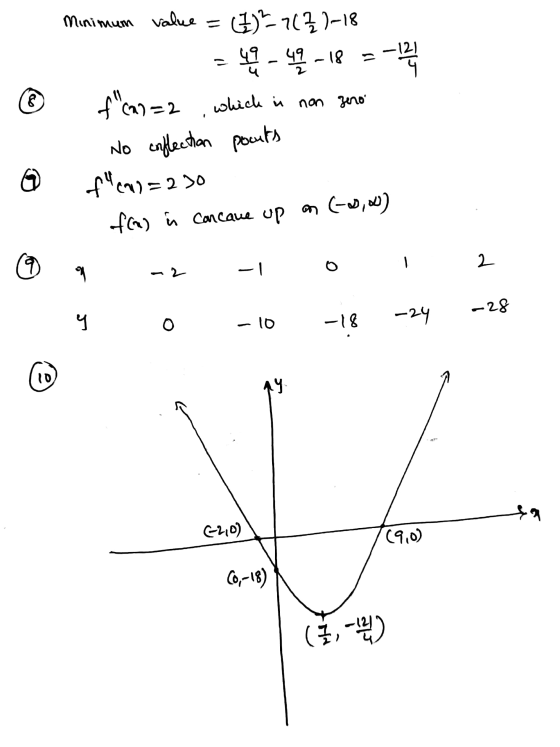
Use the steps below to sketch the graph y = x^2 - 7x - 18. Required points are the x intercepts and the max and mix of the graph
1. Determine the domain of f.
2. Find the x- and y-intercepts of f.†
3. Determine the behavior of f for large absolute values of
x.
4. Find all horizontal and vertical asymptotes of the graph of
f.
5. Determine the intervals where f is increasing and where f is
decreasing.
6. Find the relative extrema of f.
7. Determine the concavity of the graph of f.
8. Find the inflection points of f.
9. Plot a few additional points to help further identify the shape
of the graph of f and sketch the graph.
10. Use the curve-sketching guide above to sketch the graph of the
function.
Homework Answers

Add Answer to:
Use the steps below to sketch the graph y = x^2 - 7x - 18.
Required...
A Guide to Curve Sketching 1. Determine the domain of f. 2. Find the x- and...
 A Guide to Curve Sketching 1. Determine the domain of f. 2. Find the x- and y-intercepts off.* 3. Determine the behavior of f for large absolute values of x. 4. Find all horizontal and vertical asymptotes of the graph of f. 5. Determine the intervals where f is increasing and where f is decreasing, 6. Find the relative extrema of f. 7. Determine the concavity of the graph of f. 8. Find the inflection points of f. 9. Plot...
> Question 11 A Guide to Curve Sketching 1. Determine the domain off. 2. Find the...
 > Question 11 A Guide to Curve Sketching 1. Determine the domain off. 2. Find the x- and y-intercepts of f.* 3. Determine the behavior of f for large absolute values of x. 4. Find all horizontal and vertical asymptotes of the graph of f. 5. Determine the intervals where f is increasing and where f is decreasing. 6. Find the relative extrema off. 7. Determine the concavity of the graph of f. 8. Find the inflection points of f....
Sketch the graph of the function f(x) - (2-6)(x+3) 9(2+2) A sketch need not be exact...
 Sketch the graph of the function f(x) - (2-6)(x+3) 9(2+2) A sketch need not be exact or to scale! A sketch does need to show important points and features of the graph: intervals on which the function is increasing/decreasing, concavity, points at which local and absolute max, and min. values occur, inflection points, intercepts, vertical and horizontal asymptotes, and any other features particular to the particular function,
11. As a general overview, these are the details one needs to look for when sketching...
 11. As a general overview, these are the details one needs to look for when sketching curves (in no particular order: a Domain and range f. Relative extrema (maximum and minimum b. x-and y-intercepts values) c. Vertical asymptotes 9. Absolute extrema (maximum and minimum d. End behavior (including horizontal or values) polynomial asymptotes) h. Intervals of concavity e Intervals of increasing and decreasing i. Points of inflection behavior j. Other points of interest (corners, cusps, vertical tangents, discontinuities, etc) x3-3x...
Please Show ALL Work 111. Use the guidelines to sketch the curve. 1. Find the domain...
 Please Show ALL Work
111. Use the guidelines to sketch the curve. 1. Find the domain 11. Find Intercepts Symmetry (Even or Odd Function) iv. Asymptotes V. Increasing/Decreasing Intervals vi. Local Extrema Concavity and Inflection Points viii. Sketch the Graph with all above information vii. b) y = 15-5%
Please Show ALL Work
111. Use the guidelines to sketch the curve. 1. Find the domain 11. Find Intercepts Symmetry (Even or Odd Function) iv. Asymptotes V. Increasing/Decreasing Intervals vi. Local Extrema Concavity and Inflection Points viii. Sketch the Graph with all above information vii. b) y = 15-5%
Curve Sketching: Use the following guidelines to sketch the graph of y-f(x) x-5x (20 points) a. What are the behaviors of y when x->oo, or x--0? (3 points) b. What is the first derivative of t...
 Curve Sketching: Use the following guidelines to sketch the graph of y-f(x) x-5x (20 points) a. What are the behaviors of y when x->oo, or x--0? (3 points) b. What is the first derivative of this function? What are increasing intervals and decreasing intervals and max points and mini points? (6 points) c. What are the second derivative of this function? What are intervals for concavity upwards and concavity downwards and inflection points? (6 points) Use the above information (a,...
| Sketch the curve of the function f(x) = + unction f(x) = "* [r'(x) =...
 | Sketch the curve of the function f(x) = + unction f(x) = "* [r'(x) = 2*, S"(x) = 205*] Do this by determining the following information: domain, vertical asymptotes and limit - behavior, horizontal asymptotes, x \& y intercepts, symmetry, intervals of increase/decrease and maximum/minimum points, intervals of concavity and inflection points
please solve b and c 3. Use the following steps to sketch the graph of each...
 please solve b and c
3. Use the following steps to sketch the graph of each of the following functions. Step 1: Find the domain. Step 2: Find the y-intercept and all x-intercepts. Step 3: Decide if the function has any symmetry: odd, even, periodic. Step 4: Find any horizontal or vertical asymptotes. Justify using limits. Step 5: Find the critical numbers and determine intervals of increase/decrease. Step 6: Identify all local extrema. State as ordered pairs. Step 7: Determine...
please solve b and c
3. Use the following steps to sketch the graph of each of the following functions. Step 1: Find the domain. Step 2: Find the y-intercept and all x-intercepts. Step 3: Decide if the function has any symmetry: odd, even, periodic. Step 4: Find any horizontal or vertical asymptotes. Justify using limits. Step 5: Find the critical numbers and determine intervals of increase/decrease. Step 6: Identify all local extrema. State as ordered pairs. Step 7: Determine...
3.) Sketch the curve y = x - 3x1/. Before sketching please find intercepts, intervals of...
 3.) Sketch the curve y = x - 3x1/. Before sketching please find intercepts, intervals of increasing and decreasing intervals of concavity, local extreme values, and points of inflection. (5 points)
I want all the working, Thankyou 1. Investigate the function based on the properties below. Then...
 I want all the working,
Thankyou
1. Investigate the function based on the properties below. Then sketch the graph of this function. f(x)=+ In x 1.1 Domain: 1.2 Intercepts. 1.3 Symmetry. 1.4 Asymptotes. 1.5 Intervals where f(x) increasing/decreasing 1.6 Critical #. 1.7 Local max/min 1.8 Concavity 1.9 Inflection Points
I want all the working,
Thankyou
1. Investigate the function based on the properties below. Then sketch the graph of this function. f(x)=+ In x 1.1 Domain: 1.2 Intercepts. 1.3 Symmetry. 1.4 Asymptotes. 1.5 Intervals where f(x) increasing/decreasing 1.6 Critical #. 1.7 Local max/min 1.8 Concavity 1.9 Inflection Points
 A Guide to Curve Sketching 1. Determine the domain of f. 2. Find the x- and y-intercepts off.* 3. Determine the behavior of f for large absolute values of x. 4. Find all horizontal and vertical asymptotes of the graph of f. 5. Determine the intervals where f is increasing and where f is decreasing, 6. Find the relative extrema of f. 7. Determine the concavity of the graph of f. 8. Find the inflection points of f. 9. Plot...
 > Question 11 A Guide to Curve Sketching 1. Determine the domain off. 2. Find the x- and y-intercepts of f.* 3. Determine the behavior of f for large absolute values of x. 4. Find all horizontal and vertical asymptotes of the graph of f. 5. Determine the intervals where f is increasing and where f is decreasing. 6. Find the relative extrema off. 7. Determine the concavity of the graph of f. 8. Find the inflection points of f....
 Sketch the graph of the function f(x) - (2-6)(x+3) 9(2+2) A sketch need not be exact or to scale! A sketch does need to show important points and features of the graph: intervals on which the function is increasing/decreasing, concavity, points at which local and absolute max, and min. values occur, inflection points, intercepts, vertical and horizontal asymptotes, and any other features particular to the particular function,
 11. As a general overview, these are the details one needs to look for when sketching curves (in no particular order: a Domain and range f. Relative extrema (maximum and minimum b. x-and y-intercepts values) c. Vertical asymptotes 9. Absolute extrema (maximum and minimum d. End behavior (including horizontal or values) polynomial asymptotes) h. Intervals of concavity e Intervals of increasing and decreasing i. Points of inflection behavior j. Other points of interest (corners, cusps, vertical tangents, discontinuities, etc) x3-3x...
 Please Show ALL Work
111. Use the guidelines to sketch the curve. 1. Find the domain 11. Find Intercepts Symmetry (Even or Odd Function) iv. Asymptotes V. Increasing/Decreasing Intervals vi. Local Extrema Concavity and Inflection Points viii. Sketch the Graph with all above information vii. b) y = 15-5%
Please Show ALL Work
111. Use the guidelines to sketch the curve. 1. Find the domain 11. Find Intercepts Symmetry (Even or Odd Function) iv. Asymptotes V. Increasing/Decreasing Intervals vi. Local Extrema Concavity and Inflection Points viii. Sketch the Graph with all above information vii. b) y = 15-5%
 Curve Sketching: Use the following guidelines to sketch the graph of y-f(x) x-5x (20 points) a. What are the behaviors of y when x->oo, or x--0? (3 points) b. What is the first derivative of this function? What are increasing intervals and decreasing intervals and max points and mini points? (6 points) c. What are the second derivative of this function? What are intervals for concavity upwards and concavity downwards and inflection points? (6 points) Use the above information (a,...
 | Sketch the curve of the function f(x) = + unction f(x) = "* [r'(x) = 2*, S"(x) = 205*] Do this by determining the following information: domain, vertical asymptotes and limit - behavior, horizontal asymptotes, x \& y intercepts, symmetry, intervals of increase/decrease and maximum/minimum points, intervals of concavity and inflection points
 please solve b and c
3. Use the following steps to sketch the graph of each of the following functions. Step 1: Find the domain. Step 2: Find the y-intercept and all x-intercepts. Step 3: Decide if the function has any symmetry: odd, even, periodic. Step 4: Find any horizontal or vertical asymptotes. Justify using limits. Step 5: Find the critical numbers and determine intervals of increase/decrease. Step 6: Identify all local extrema. State as ordered pairs. Step 7: Determine...
please solve b and c
3. Use the following steps to sketch the graph of each of the following functions. Step 1: Find the domain. Step 2: Find the y-intercept and all x-intercepts. Step 3: Decide if the function has any symmetry: odd, even, periodic. Step 4: Find any horizontal or vertical asymptotes. Justify using limits. Step 5: Find the critical numbers and determine intervals of increase/decrease. Step 6: Identify all local extrema. State as ordered pairs. Step 7: Determine...
 3.) Sketch the curve y = x - 3x1/. Before sketching please find intercepts, intervals of increasing and decreasing intervals of concavity, local extreme values, and points of inflection. (5 points)
 I want all the working,
Thankyou
1. Investigate the function based on the properties below. Then sketch the graph of this function. f(x)=+ In x 1.1 Domain: 1.2 Intercepts. 1.3 Symmetry. 1.4 Asymptotes. 1.5 Intervals where f(x) increasing/decreasing 1.6 Critical #. 1.7 Local max/min 1.8 Concavity 1.9 Inflection Points
I want all the working,
Thankyou
1. Investigate the function based on the properties below. Then sketch the graph of this function. f(x)=+ In x 1.1 Domain: 1.2 Intercepts. 1.3 Symmetry. 1.4 Asymptotes. 1.5 Intervals where f(x) increasing/decreasing 1.6 Critical #. 1.7 Local max/min 1.8 Concavity 1.9 Inflection Points
Most questions answered within 3 hours.
-
3) What are the typical social structures in a global city?
asked 55 minutes ago -
Luther Corporation
Consolidated Balance Sheet
December 31, 2019 and 2018 (in $ millions)
Assets
2019
2018...
asked 57 minutes ago -
(Expected rate of return and risk) Carter Inc. is evaluating a
security. Calculate the investment’s expected...
asked 3 hours ago -
What specific indicators can point to lack of progress for
African Americans in American society?
asked 4 hours ago -
1-The Electrons in a beam are moving at 2.7×10⁸ m/s in an
electric field of 15000...
asked 4 hours ago -
A gas tank is a vertical cylinder. It has a radius of 1m, a
height of...
asked 5 hours ago -
Accent Software faces the following conditions. All of these
support Accent’s use of a market-penetration pricing...
asked 6 hours ago -
A mathematically inclined friend emails you the following
instructions: "Meet me in the cafeteria the first...
asked 6 hours ago -
A monopoly sells in two countries . The demand curves in the two
countries are p1...
asked 7 hours ago -
A .15kg rubber ball is bounced off a wall. Before hitting the
wall, the ball moves...
asked 7 hours ago -
A manufacturing company preparing to build a new plant is
considering three potential locations for it....
asked 8 hours ago -
B. If compound Y has approximately the same values of solubility
in toluene as compound X,...
asked 8 hours ago