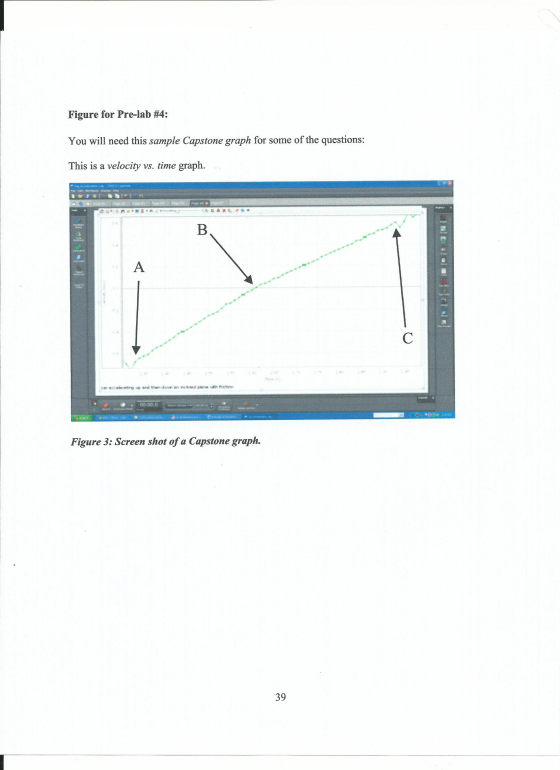
See the example Capstone graph from the Lab Manual (Figure 3, a
velocity vs. time curve). What region of this graph represents the
time when the cart is moving down the incline?
1) From A to C
2) From B to C
3) From A to B
I am not certain how to answer this. Please help as soon as
possible? Thank you?
2nd Question:
See the example Capstone graph from the Lab Manual (Figure 3, a
velocity vs. time curve). Once you have created a graph like this,
what will you do with it?
1) Make a quadratic fit to the data (From A to C) to find the
acceleration.
2) Find the time at which the curve crosses the V=0 x-axis(point
B).
3) Make a linear fit to the data(From A to C) to find the
acceleration.
4) Make two linear fits to the data (one from A to B, and the other
from B to C), to find two accelerations.
5) Make two quadratic fits to the data(one from A to B, and the
other from B to C), to find two accelerations.
I'm stuck between 3 and 4 answers. one linear or two linears??
Please help soon as possible. Thank you.
Homework Answers

Add Answer to:
See the example Capstone graph from the Lab Manual (Figure 3, a
velocity vs. time curve)....
need help please DO A QUADRATIC FIT ON THE POSITION VS, TIME GRAPH, THE VALUE OF...
 need help please
DO A QUADRATIC FIT ON THE POSITION VS, TIME GRAPH, THE VALUE OF THE QUADRATIC "A QUAL TO HALF OF THE ACCELERATION. WHY? D A ALUINEAR FIT ON THE VELOCITY VS. TIME GRAPH. THE VALUE OF THE SLOPE IS EQUAL TO THE ACCELERATION, WHY? COMPARE THE ACCELERATION VALUES FROM BOTH GRAPHS. DO PERCENT DIFFERENCE. POST-LAB QUESTIONS: IF THE CART DID NOT ACCELERATE, WHAT WOULD BE THE SHAPES OF THE POSITION VS. TIME AND THE VELOCITY VS. TIME...
need help please
DO A QUADRATIC FIT ON THE POSITION VS, TIME GRAPH, THE VALUE OF THE QUADRATIC "A QUAL TO HALF OF THE ACCELERATION. WHY? D A ALUINEAR FIT ON THE VELOCITY VS. TIME GRAPH. THE VALUE OF THE SLOPE IS EQUAL TO THE ACCELERATION, WHY? COMPARE THE ACCELERATION VALUES FROM BOTH GRAPHS. DO PERCENT DIFFERENCE. POST-LAB QUESTIONS: IF THE CART DID NOT ACCELERATE, WHAT WOULD BE THE SHAPES OF THE POSITION VS. TIME AND THE VELOCITY VS. TIME...
Please note that X is time Value Position vs Time Linear Fit m y = mx...
 Please note that X is
time
Value Position vs Time Linear Fit m y = mx + b Quadratic Fit Α. B 0.305 -0.0583 y=0.305x -0.0583 4 1 0.110 -0.0663 0.195... yöllx'-0.0663x7.195 |(1.550, 0.359) 1(1.600,0.373) 0.28 y = Ax?+ Bx + C (x1, yı) (x2, Y2) Slope For Position vs Time data: (a) Did your quadratic fit of this graph provide initial position? If yes, what is its value? (4 points) (b) Did your quadratic fit of this graph provide...
Please note that X is
time
Value Position vs Time Linear Fit m y = mx + b Quadratic Fit Α. B 0.305 -0.0583 y=0.305x -0.0583 4 1 0.110 -0.0663 0.195... yöllx'-0.0663x7.195 |(1.550, 0.359) 1(1.600,0.373) 0.28 y = Ax?+ Bx + C (x1, yı) (x2, Y2) Slope For Position vs Time data: (a) Did your quadratic fit of this graph provide initial position? If yes, what is its value? (4 points) (b) Did your quadratic fit of this graph provide...
For this page: The person's velocity vs. time graph is given to be: 4 Velocity (m/s)...
 For this page: The person's velocity vs. time graph is given to be: 4 Velocity (m/s) 0.50 m/s 2.0 4.0 Time (s) -0.5 m/s the position vs. time graph. Include units, labels, and numerical values on the graph. B. What is the person's average velocity? What is the person's average speed? D What is the person's instantaneous acceleration att3.0 s? , what is the person's instantaneous velocity at t = 1.0 s? PHY 201 Lab Manual
Part 2: Velocity vs. Time 1. For each velocity vs. time graph (Graph 3 and 4), describe how you w...
 Part 2: Velocity vs. Time 1. For each velocity vs. time graph (Graph 3 and 4), describe how you would walk in order to replicate the 1-D motion graph. Use words such as away, toward, at rest, speeding up, slowing down, constant speed. Be specific with your time periods. 2. For each velocity vs. time graph, create the corresponding position and acceleration versus time graphs. Construct your graph on a computer program such as Microsoft ExcelB. If you do not...
PHY 201 Lab Mansal (Spring For this page: The person's velocity vs. time graph is given...
 PHY 201 Lab Mansal (Spring For this page: The person's velocity vs. time graph is given to be PHY 201 Lab Manaal (Spring 2019 version) For this page: The person moves forward slowly with a back to the initial position quickly, with a speed of 2.0 m/s speed of 1.0 m/s for 2.0s then comes 18. Sketch the position va. time graph. Include units,Ilabels, and numerical values on the graph BSketch the velocity vs. time graph. Include units, labels, and...
5. During a lab, you measure the below data of velocity vs. time for a cart...
 5. During a lab, you measure the below data of velocity vs. time for a cart undergoing constant acceleration in an experiment. What is the acceleration of your cart? Velocity vs. Time 200 180 160 140 y(t)-b+mt Fit Result: 120 100 b-0.5 80 m-2 60 40 20 180 12 40 60 80 100 Time [s] 10 Velocity [m/s] 20
Lab 3 Data Write the equation of best fit for the x direction velocity vs time...
 Lab 3 Data Write the equation of best fit for the x direction velocity vs time graph. Hint: it's a constant value as time proceeds... X Velocity (m/s) 1.6 III II 1.2 III 1.4 Time (s)
6 -6 points SerCP11 2P024 The velocity vs. time graph for an object moving along a...
 6 -6 points SerCP11 2P024 The velocity vs. time graph for an object moving along a straight path is shown in the figure below. u (m/s) 0 15 20(s) (1)Find the average acceleration of this object during the following time intervals. (a) 0 s to 5.0s m/s2 (b) 5.0 s to 15s (c) 0s to 20s ()Find the instantaneous accelerations at the following times. (a) 2.0 s m/s2 (b) 10 s (c) 18 s m/s2 Need Help? Resd MacBook Pro...
Sketch a plot of velocity vs time for Figure 3 of this lab, labeling the axis...
 Sketch a plot of velocity vs time for Figure 3 of this lab,
labeling the axis in m/s and s.
2 0.5 0 2 3 4 6 Time,s Figure 3. Match this position vs time plot.
Sketch a plot of velocity vs time for Figure 3 of this lab,
labeling the axis in m/s and s.
2 0.5 0 2 3 4 6 Time,s Figure 3. Match this position vs time plot.
 need help please
DO A QUADRATIC FIT ON THE POSITION VS, TIME GRAPH, THE VALUE OF THE QUADRATIC "A QUAL TO HALF OF THE ACCELERATION. WHY? D A ALUINEAR FIT ON THE VELOCITY VS. TIME GRAPH. THE VALUE OF THE SLOPE IS EQUAL TO THE ACCELERATION, WHY? COMPARE THE ACCELERATION VALUES FROM BOTH GRAPHS. DO PERCENT DIFFERENCE. POST-LAB QUESTIONS: IF THE CART DID NOT ACCELERATE, WHAT WOULD BE THE SHAPES OF THE POSITION VS. TIME AND THE VELOCITY VS. TIME...
need help please
DO A QUADRATIC FIT ON THE POSITION VS, TIME GRAPH, THE VALUE OF THE QUADRATIC "A QUAL TO HALF OF THE ACCELERATION. WHY? D A ALUINEAR FIT ON THE VELOCITY VS. TIME GRAPH. THE VALUE OF THE SLOPE IS EQUAL TO THE ACCELERATION, WHY? COMPARE THE ACCELERATION VALUES FROM BOTH GRAPHS. DO PERCENT DIFFERENCE. POST-LAB QUESTIONS: IF THE CART DID NOT ACCELERATE, WHAT WOULD BE THE SHAPES OF THE POSITION VS. TIME AND THE VELOCITY VS. TIME...
 Please note that X is
time
Value Position vs Time Linear Fit m y = mx + b Quadratic Fit Α. B 0.305 -0.0583 y=0.305x -0.0583 4 1 0.110 -0.0663 0.195... yöllx'-0.0663x7.195 |(1.550, 0.359) 1(1.600,0.373) 0.28 y = Ax?+ Bx + C (x1, yı) (x2, Y2) Slope For Position vs Time data: (a) Did your quadratic fit of this graph provide initial position? If yes, what is its value? (4 points) (b) Did your quadratic fit of this graph provide...
Please note that X is
time
Value Position vs Time Linear Fit m y = mx + b Quadratic Fit Α. B 0.305 -0.0583 y=0.305x -0.0583 4 1 0.110 -0.0663 0.195... yöllx'-0.0663x7.195 |(1.550, 0.359) 1(1.600,0.373) 0.28 y = Ax?+ Bx + C (x1, yı) (x2, Y2) Slope For Position vs Time data: (a) Did your quadratic fit of this graph provide initial position? If yes, what is its value? (4 points) (b) Did your quadratic fit of this graph provide...
 For this page: The person's velocity vs. time graph is given to be: 4 Velocity (m/s) 0.50 m/s 2.0 4.0 Time (s) -0.5 m/s the position vs. time graph. Include units, labels, and numerical values on the graph. B. What is the person's average velocity? What is the person's average speed? D What is the person's instantaneous acceleration att3.0 s? , what is the person's instantaneous velocity at t = 1.0 s? PHY 201 Lab Manual
 Part 2: Velocity vs. Time 1. For each velocity vs. time graph (Graph 3 and 4), describe how you would walk in order to replicate the 1-D motion graph. Use words such as away, toward, at rest, speeding up, slowing down, constant speed. Be specific with your time periods. 2. For each velocity vs. time graph, create the corresponding position and acceleration versus time graphs. Construct your graph on a computer program such as Microsoft ExcelB. If you do not...
 PHY 201 Lab Mansal (Spring For this page: The person's velocity vs. time graph is given to be PHY 201 Lab Manaal (Spring 2019 version) For this page: The person moves forward slowly with a back to the initial position quickly, with a speed of 2.0 m/s speed of 1.0 m/s for 2.0s then comes 18. Sketch the position va. time graph. Include units,Ilabels, and numerical values on the graph BSketch the velocity vs. time graph. Include units, labels, and...
 5. During a lab, you measure the below data of velocity vs. time for a cart undergoing constant acceleration in an experiment. What is the acceleration of your cart? Velocity vs. Time 200 180 160 140 y(t)-b+mt Fit Result: 120 100 b-0.5 80 m-2 60 40 20 180 12 40 60 80 100 Time [s] 10 Velocity [m/s] 20
 Lab 3 Data Write the equation of best fit for the x direction velocity vs time graph. Hint: it's a constant value as time proceeds... X Velocity (m/s) 1.6 III II 1.2 III 1.4 Time (s)
 6 -6 points SerCP11 2P024 The velocity vs. time graph for an object moving along a straight path is shown in the figure below. u (m/s) 0 15 20(s) (1)Find the average acceleration of this object during the following time intervals. (a) 0 s to 5.0s m/s2 (b) 5.0 s to 15s (c) 0s to 20s ()Find the instantaneous accelerations at the following times. (a) 2.0 s m/s2 (b) 10 s (c) 18 s m/s2 Need Help? Resd MacBook Pro...
 Sketch a plot of velocity vs time for Figure 3 of this lab,
labeling the axis in m/s and s.
2 0.5 0 2 3 4 6 Time,s Figure 3. Match this position vs time plot.
Sketch a plot of velocity vs time for Figure 3 of this lab,
labeling the axis in m/s and s.
2 0.5 0 2 3 4 6 Time,s Figure 3. Match this position vs time plot.
Most questions answered within 3 hours.
-
Calculate the pH of each of the following solutions.
0.50 M HBr
3.1×10⁻⁴ M KOH
4.2×10⁻⁵...
asked 1 hour ago -
For the year ended December 31, Depot Max’s cost of merchandise
sold was $85,600. Inventory at the...
asked 1 hour ago -
Week 10 - Professional Memo Assignment
Professional Memo Assignment
Your mission for this week, should you...
asked 1 hour ago -
Write a Python program that stores the data for each
player on the team, and it...
asked 1 hour ago -
In
the last 3 months, mike never knows when he is going to get his
allowance...
asked 2 hours ago -
Is Ca(OH)2 a Bronsted base, Lewis base, or both? Why?
asked 2 hours ago -
1A- Why don’t voters complain about U.S. tariffs on imported
sugar?
Because sugar is only a...
asked 2 hours ago -
Cash Payback Period
Primera Banco is evaluating two capital investment proposals for
a drive-up ATM kiosk,...
asked 2 hours ago -
Create a button in Swift (Xcode) that will create a charge,
create a charge using Stripe's...
asked 2 hours ago -
The reaction rate of CO and NO2 in the reaction
CO(g) + NO2(g) → CO2(g) +...
asked 2 hours ago -
Imagine that a chemist puts 6.40 mol each of
C3H8 and O2 in a 1.00-L container...
asked 2 hours ago -
How much money should be invested today in order to have $8340
at the end of...
asked 2 hours ago