
Homework Answers
If a particle starts from position with initial velocity
, and
acceleration
(constant).
Position of particle as a function of time is
During the position time plot(quadratic fit), equation used is
Comparing the two equations,
Hence A is equal to half of the acceleration.
---------------
When a particle moves with initial velocity , and acceleration
Velocity of a particle as a function of time is
For the linear fit of velocity Vs time, the equation used is
comparing the above two equations, ,
That is slope of best fit line is equal to
acceleration (
).
-----------------
Acceleration from quadratic fit is
Acceleration from best fit line is
Percentage difference in accelerations is
----------------
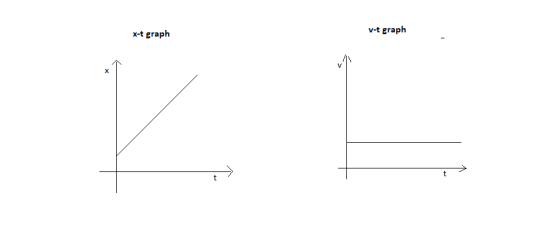
If the cart did not accelerate, velocity will be constant.( acceleration is zero)
,
Add Answer to:
need help please
DO A QUADRATIC FIT ON THE POSITION VS, TIME GRAPH, THE VALUE OF...
Please note that X is time Value Position vs Time Linear Fit m y = mx...
 Please note that X is
time
Value Position vs Time Linear Fit m y = mx + b Quadratic Fit Α. B 0.305 -0.0583 y=0.305x -0.0583 4 1 0.110 -0.0663 0.195... yöllx'-0.0663x7.195 |(1.550, 0.359) 1(1.600,0.373) 0.28 y = Ax?+ Bx + C (x1, yı) (x2, Y2) Slope For Position vs Time data: (a) Did your quadratic fit of this graph provide initial position? If yes, what is its value? (4 points) (b) Did your quadratic fit of this graph provide...
Please note that X is
time
Value Position vs Time Linear Fit m y = mx + b Quadratic Fit Α. B 0.305 -0.0583 y=0.305x -0.0583 4 1 0.110 -0.0663 0.195... yöllx'-0.0663x7.195 |(1.550, 0.359) 1(1.600,0.373) 0.28 y = Ax?+ Bx + C (x1, yı) (x2, Y2) Slope For Position vs Time data: (a) Did your quadratic fit of this graph provide initial position? If yes, what is its value? (4 points) (b) Did your quadratic fit of this graph provide...
1) a) For the position vs. time graph shown below, sketch the velocity vs. time and...
 1) a) For the position vs. time graph shown below, sketch the velocity vs. time and acceleration vs. time graphs corresponding to the motion. (5 pts each) Beside the position and acceleration graphs, describe the motion of the object and explain why you drew the graph the way you did. (10 pts) 25 pts total
The slope A of your best fit line on the force vs acceleration graph should be...
 The slope A of your best fit line on the force vs acceleration
graph should be equal to the mass of the cart and probe (in kg), if
force and acceleration truly are proportional. How does the slope
value compare with the mass value?
The slope A of your best fit line on the force vs acceleration
graph should be equal to the mass of the cart and probe (in kg), if
force and acceleration truly are proportional. How does the slope
value compare with the mass value?
Please answer physics lab questions SECTION: DATE: ANALYSIS PARTI: POSITION VS. TIME GRAPH MATCHING I. Describe...
 Please answer physics lab questions
SECTION: DATE: ANALYSIS PARTI: POSITION VS. TIME GRAPH MATCHING I. Describe how you walked for each of the graphs that you matched. When the aph hada honit. period wedid net mare wiun the crapん1ad a linlan perod we moved but at o constan sperd Explain the significance of the slope of a position vs. time graph. Include a discussion of positive 2. and negative slope. 3. What type of motion is occurring when the slope...
Please answer physics lab questions
SECTION: DATE: ANALYSIS PARTI: POSITION VS. TIME GRAPH MATCHING I. Describe how you walked for each of the graphs that you matched. When the aph hada honit. period wedid net mare wiun the crapん1ad a linlan perod we moved but at o constan sperd Explain the significance of the slope of a position vs. time graph. Include a discussion of positive 2. and negative slope. 3. What type of motion is occurring when the slope...
Please explain For each of the velocity vs. time graphs below, sketch possible comesponding position vs....
 Please explain
For each of the velocity vs. time graphs below, sketch possible comesponding position vs. time and acceleration vs. time graphs. To the right of the graph, briefly describe the motion of the object and why the graphs you drew are consistent with the velocity graph. Where is the object at time t 0 in each case? Explain
Please explain
For each of the velocity vs. time graphs below, sketch possible comesponding position vs. time and acceleration vs. time graphs. To the right of the graph, briefly describe the motion of the object and why the graphs you drew are consistent with the velocity graph. Where is the object at time t 0 in each case? Explain
For each of the velocity vs. time graphs below, sketch possible corresponding position vs. time and...
 For each of the velocity vs. time graphs below, sketch possible
corresponding position vs. time and acceleration vs. time graphs.
To the right of the graph, briefly describe the motion of the
object and why the graphs you drew are consistent with the velocity
graph. Where is the object at time t = 0 in each case?
Explain.
For each of the velocity vs. time graphs below, sketch possible
corresponding position vs. time and acceleration vs. time graphs.
To the right of the graph, briefly describe the motion of the
object and why the graphs you drew are consistent with the velocity
graph. Where is the object at time t = 0 in each case?
Explain.
Part 2: Velocity vs. Time 1. For each velocity vs. time graph (Graph 3 and 4), describe how you w...
 Part 2: Velocity vs. Time 1. For each velocity vs. time graph (Graph 3 and 4), describe how you would walk in order to replicate the 1-D motion graph. Use words such as away, toward, at rest, speeding up, slowing down, constant speed. Be specific with your time periods. 2. For each velocity vs. time graph, create the corresponding position and acceleration versus time graphs. Construct your graph on a computer program such as Microsoft ExcelB. If you do not...
Constant Positive Accederation Recall that acceleration is the slope of the v-t graph Position vs. Time...
 Constant Positive Accederation Recall that acceleration is the slope of the v-t graph Position vs. Time Time (s1 Position ml Velocity bos) 0 0.2 2.5 0.4 1.5 0.5 0.6 Velocity vs. Time 0.8 1.2 2.5 1.4 0.5 Timet s 1 1.6 Acceleration vs. Time 1.8 0.5 1.5 s utat V ut at Timet S i 5 15
Choose a function to represent the acceleration vs. time graph. How can you calculate the values...
Choose a function to represent the acceleration vs. time graph. How can you calculate the values of the constants of this function from the function representing the position versus time graph? Check how well this works. You can also estimate the values of the constants from the graph. What kinematics quantities do these constants represent? Record the corresponding kinematic quantities and the values of the corresponding errors. From either the position vs. time, velocity vs. time, or acceleration vs. time...
Please help with this Kinematics question! Position and time graphs. Velocity vs. time graph. Consider this...
 Please help with this Kinematics question! Position and time
graphs. Velocity vs. time graph.
Consider this position vs. does the corresponding velocity vs. time graph look like? 1. time graph. What (a) Sketch your prediction below * Now reproduce the position graph by walking, and see if the velocity graph comes out the way you expect. 10 t (seconds) Velocity Graph Prediction Velocity Graph Result (m/s) o (m/s) 0 10 6 10 t (seconds) t (seconds) 2. Here's a velocity...
Please help with this Kinematics question! Position and time
graphs. Velocity vs. time graph.
Consider this position vs. does the corresponding velocity vs. time graph look like? 1. time graph. What (a) Sketch your prediction below * Now reproduce the position graph by walking, and see if the velocity graph comes out the way you expect. 10 t (seconds) Velocity Graph Prediction Velocity Graph Result (m/s) o (m/s) 0 10 6 10 t (seconds) t (seconds) 2. Here's a velocity...
 Please note that X is
time
Value Position vs Time Linear Fit m y = mx + b Quadratic Fit Α. B 0.305 -0.0583 y=0.305x -0.0583 4 1 0.110 -0.0663 0.195... yöllx'-0.0663x7.195 |(1.550, 0.359) 1(1.600,0.373) 0.28 y = Ax?+ Bx + C (x1, yı) (x2, Y2) Slope For Position vs Time data: (a) Did your quadratic fit of this graph provide initial position? If yes, what is its value? (4 points) (b) Did your quadratic fit of this graph provide...
Please note that X is
time
Value Position vs Time Linear Fit m y = mx + b Quadratic Fit Α. B 0.305 -0.0583 y=0.305x -0.0583 4 1 0.110 -0.0663 0.195... yöllx'-0.0663x7.195 |(1.550, 0.359) 1(1.600,0.373) 0.28 y = Ax?+ Bx + C (x1, yı) (x2, Y2) Slope For Position vs Time data: (a) Did your quadratic fit of this graph provide initial position? If yes, what is its value? (4 points) (b) Did your quadratic fit of this graph provide...
 1) a) For the position vs. time graph shown below, sketch the velocity vs. time and acceleration vs. time graphs corresponding to the motion. (5 pts each) Beside the position and acceleration graphs, describe the motion of the object and explain why you drew the graph the way you did. (10 pts) 25 pts total
 The slope A of your best fit line on the force vs acceleration
graph should be equal to the mass of the cart and probe (in kg), if
force and acceleration truly are proportional. How does the slope
value compare with the mass value?
The slope A of your best fit line on the force vs acceleration
graph should be equal to the mass of the cart and probe (in kg), if
force and acceleration truly are proportional. How does the slope
value compare with the mass value?
 Please answer physics lab questions
SECTION: DATE: ANALYSIS PARTI: POSITION VS. TIME GRAPH MATCHING I. Describe how you walked for each of the graphs that you matched. When the aph hada honit. period wedid net mare wiun the crapん1ad a linlan perod we moved but at o constan sperd Explain the significance of the slope of a position vs. time graph. Include a discussion of positive 2. and negative slope. 3. What type of motion is occurring when the slope...
Please answer physics lab questions
SECTION: DATE: ANALYSIS PARTI: POSITION VS. TIME GRAPH MATCHING I. Describe how you walked for each of the graphs that you matched. When the aph hada honit. period wedid net mare wiun the crapん1ad a linlan perod we moved but at o constan sperd Explain the significance of the slope of a position vs. time graph. Include a discussion of positive 2. and negative slope. 3. What type of motion is occurring when the slope...
 Please explain
For each of the velocity vs. time graphs below, sketch possible comesponding position vs. time and acceleration vs. time graphs. To the right of the graph, briefly describe the motion of the object and why the graphs you drew are consistent with the velocity graph. Where is the object at time t 0 in each case? Explain
Please explain
For each of the velocity vs. time graphs below, sketch possible comesponding position vs. time and acceleration vs. time graphs. To the right of the graph, briefly describe the motion of the object and why the graphs you drew are consistent with the velocity graph. Where is the object at time t 0 in each case? Explain
 For each of the velocity vs. time graphs below, sketch possible
corresponding position vs. time and acceleration vs. time graphs.
To the right of the graph, briefly describe the motion of the
object and why the graphs you drew are consistent with the velocity
graph. Where is the object at time t = 0 in each case?
Explain.
For each of the velocity vs. time graphs below, sketch possible
corresponding position vs. time and acceleration vs. time graphs.
To the right of the graph, briefly describe the motion of the
object and why the graphs you drew are consistent with the velocity
graph. Where is the object at time t = 0 in each case?
Explain.
 Part 2: Velocity vs. Time 1. For each velocity vs. time graph (Graph 3 and 4), describe how you would walk in order to replicate the 1-D motion graph. Use words such as away, toward, at rest, speeding up, slowing down, constant speed. Be specific with your time periods. 2. For each velocity vs. time graph, create the corresponding position and acceleration versus time graphs. Construct your graph on a computer program such as Microsoft ExcelB. If you do not...
 Constant Positive Accederation Recall that acceleration is the slope of the v-t graph Position vs. Time Time (s1 Position ml Velocity bos) 0 0.2 2.5 0.4 1.5 0.5 0.6 Velocity vs. Time 0.8 1.2 2.5 1.4 0.5 Timet s 1 1.6 Acceleration vs. Time 1.8 0.5 1.5 s utat V ut at Timet S i 5 15
 Please help with this Kinematics question! Position and time
graphs. Velocity vs. time graph.
Consider this position vs. does the corresponding velocity vs. time graph look like? 1. time graph. What (a) Sketch your prediction below * Now reproduce the position graph by walking, and see if the velocity graph comes out the way you expect. 10 t (seconds) Velocity Graph Prediction Velocity Graph Result (m/s) o (m/s) 0 10 6 10 t (seconds) t (seconds) 2. Here's a velocity...
Please help with this Kinematics question! Position and time
graphs. Velocity vs. time graph.
Consider this position vs. does the corresponding velocity vs. time graph look like? 1. time graph. What (a) Sketch your prediction below * Now reproduce the position graph by walking, and see if the velocity graph comes out the way you expect. 10 t (seconds) Velocity Graph Prediction Velocity Graph Result (m/s) o (m/s) 0 10 6 10 t (seconds) t (seconds) 2. Here's a velocity...
Most questions answered within 3 hours.
-
A coach uses a new technique to train gymnasts. Seven
gymnasts were randomly selected and their...
asked 1 hour ago -
While rotating the tires on your car you notice a rock [mass =
0.1 Kg] stuck...
asked 3 hours ago -
Using MARS simulator, write MIPS programs according to
the following scenarios: Receive a positive integer number...
asked 5 hours ago -
An object in front of a concave mirror has a real image that is
11.5 cm...
asked 5 hours ago -
Consider the reaction, C3 H8 + O2 --> CO2 + H2O. How many
moles of O2...
asked 7 hours ago -
You and your opponent both roll a fair die. If you both roll the
same number,...
asked 7 hours ago -
In a study of the accuracy of fast food drive-through orders,
Restaurant A had 257 accurate...
asked 7 hours ago -
Identify and describe in detail the four categories of
institutions that could be included in a...
asked 7 hours ago -
In python
class Customer:
def __init__(self, customer_id, last_name, first_name, phone_number, address):
self._customer_id = int(customer_id)
self._last_name =...
asked 7 hours ago -
What is an example of a limitation in implementing a new
ERP system and how it...
asked 7 hours ago -
In a section of 9.7cm of an artery with a radius of 2.6mm there
is a...
asked 7 hours ago -
the two carboxylic acid groups of aspartic acid have different
acidities with pKa values of 2.1...
asked 7 hours ago