
Homework Answers

Note- please find me in comment box if you find any difficulty.
Add Answer to:
Problem 3. Sketch the Bode plot (magnitude only) for the following transfer function. Label all slopes...
How to Sketch a bode plot for the transfer function given below indicating approximate amplitudes, slopes...
 How to Sketch a bode plot for the transfer function given below
indicating approximate amplitudes, slopes (in dB/decade) and
frequency values (in Hertz).
(s? +4) (52 +220 + 4000)
How to Sketch a bode plot for the transfer function given below
indicating approximate amplitudes, slopes (in dB/decade) and
frequency values (in Hertz).
(s? +4) (52 +220 + 4000)
Problem Three: Estimating a Transfer Function from a Bode Plot Based on the Bode Plot below,...
 Problem Three: Estimating a Transfer Function from a Bode Plot Based on the Bode Plot below, estimate the transfer function for this system. magnitude plot 20 0 2010g, ((w)) 40 -60 -80 10-2 10-1 10° 101 102 w (rad/s) phase plot 100 50 © -50 -100 102 10" 10° 102 10 101 (rad/s]
Sketch the magnitude characteristic of the Bode plot for the transfer function (3 marks) G(0) =...
 Sketch the magnitude characteristic of the Bode plot for the transfer function (3 marks) G(0) = -02.104 (jo+1)2.jw+10)-(+100)
i) Draw the Bode plots (hand sketch, magnitude and phase!) for the following transfer function. Plot...
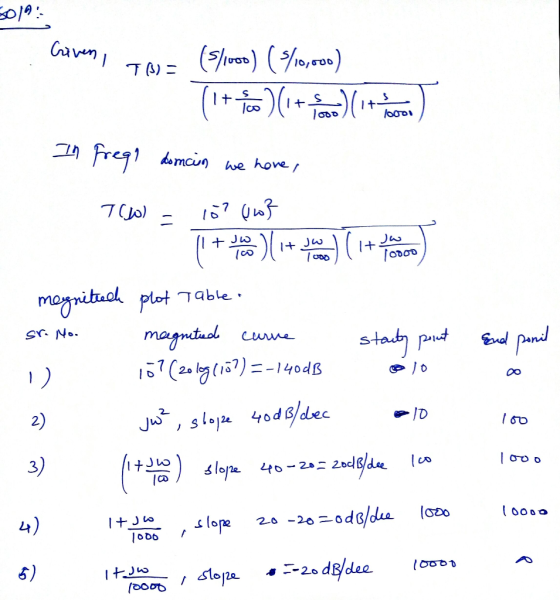
 i) Draw the Bode plots (hand sketch, magnitude and phase!) for the following transfer function. Plot over the range 0.1 to 1000 rad/s HS 10,000 (s) = s* + 20s 10,000 ii) what are the Q and Bw for this circuit? iii) Design and draw a circuit (including values) that would yield this transfer function. It should use a 100mH inductor , , Qano
1.8 k2 400 Ω 900 Ω luFuo(1) 1). Determine the transfer function G,(o)o) 2). Sketch the...
 1.8 k2 400 Ω 900 Ω luFuo(1) 1). Determine the transfer function G,(o)o) 2). Sketch the magnitude characteristic of the transfer function. (No need to use a bode plot paper. Sketch it in the booklet and label the break frequency, magnitude in dB and any slopes in dB/dec) 3). What is the actual magnitude (in dB) of the transfer function at the break frequency?
1.2 [30 Marks] Sketch an approximation of the Bode Plot for the following process. Label any...
 1.2 [30 Marks] Sketch an approximation of the Bode Plot for the following process. Label any break frequencies and slopes in terms of dB / decade. S( S+ 10) G(S) (s+0.01)(S+0.1)(8+100)
4. Sketch the Bode magnitude plot ofa fiter having a transfer function 10's H(s)- (s+500) (s+S0s+...
 4. Sketch the Bode magnitude plot ofa fiter having a transfer function 10's H(s)- (s+500) (s+S0s+2500) he following senilog graph to sketch yo ur plot (and please scale the eequeney axis proper a) Please use t receive full credits) b) What kind of filter is it and why? read the approximate 3-dB cut-off frequencies of the filter From your plot ont is the asrsximate.ostt of the filter due to an input, st)- 2sin(400)-3os(10 a) c) frequency axis properly a) Please...
Prepare the Bode Plot of the following transfer function (show only the asymptotes Gls)-1,000 s (s...
 Prepare the Bode Plot of the following transfer function (show only the asymptotes Gls)-1,000 s (s 1)s+1000PV (s+10P (s+10011 The amplitude at w-0.1 rad/sec the slope between 0.1 rad/s and 1 rad/s db db/dec, db/dec the slope between 1 rad/s and 10 rad/s the slope between 10 rad/s and 100 rad/s db/dec db/dec the slope between 100 rad/s and 1,000 rad/s db/dec, the slope between 1,000 rad/s and 10,000 rad/s phase angle at 0.001 rad/s degrees, phase angle at 10,000...
3. You are given the following Bode diagrams for different systems. Find the transfer function for...
 3. You are given the following Bode diagrams for different systems. Find the transfer function for each one of the systems considering the asymptotes and breaking points. 2.5 An C. - - - Magnitude (dB) Magnitude (dB) 10-1 100 101 10% 10° Frequency (rad/s) Frequency (rad/s) Magnitude (dB) Magnitude (dB) 100 101 101 Frequency (rad/s) 100 101 10² Frequency (rad/s) 103 104
Chapter 12, Problem 12.21 (Multistep) Part 1 Correct. Sketch the magnitude characteristic of the Bode plot...
 Chapter 12, Problem 12.21 (Multistep) Part 1 Correct. Sketch the magnitude characteristic of the Bode plot for the transfer function 30(0.060 * jo + 1) jojo + 1)(0.0024 * ja + 1) H0) = Shown here is the radian frequency axis for w > 0. The labeled frequencies represent the break frequencies in the transfer function H(o) (not necessarily drawn to scale). -+ W + w W3 W (rad/sec) What are the numerical values of the break frequencies w1, wz,...
 How to Sketch a bode plot for the transfer function given below
indicating approximate amplitudes, slopes (in dB/decade) and
frequency values (in Hertz).
(s? +4) (52 +220 + 4000)
How to Sketch a bode plot for the transfer function given below
indicating approximate amplitudes, slopes (in dB/decade) and
frequency values (in Hertz).
(s? +4) (52 +220 + 4000)
 Problem Three: Estimating a Transfer Function from a Bode Plot Based on the Bode Plot below, estimate the transfer function for this system. magnitude plot 20 0 2010g, ((w)) 40 -60 -80 10-2 10-1 10° 101 102 w (rad/s) phase plot 100 50 © -50 -100 102 10" 10° 102 10 101 (rad/s]
 Sketch the magnitude characteristic of the Bode plot for the transfer function (3 marks) G(0) = -02.104 (jo+1)2.jw+10)-(+100)
 i) Draw the Bode plots (hand sketch, magnitude and phase!) for the following transfer function. Plot over the range 0.1 to 1000 rad/s HS 10,000 (s) = s* + 20s 10,000 ii) what are the Q and Bw for this circuit? iii) Design and draw a circuit (including values) that would yield this transfer function. It should use a 100mH inductor , , Qano
 1.8 k2 400 Ω 900 Ω luFuo(1) 1). Determine the transfer function G,(o)o) 2). Sketch the magnitude characteristic of the transfer function. (No need to use a bode plot paper. Sketch it in the booklet and label the break frequency, magnitude in dB and any slopes in dB/dec) 3). What is the actual magnitude (in dB) of the transfer function at the break frequency?
 1.2 [30 Marks] Sketch an approximation of the Bode Plot for the following process. Label any break frequencies and slopes in terms of dB / decade. S( S+ 10) G(S) (s+0.01)(S+0.1)(8+100)
 4. Sketch the Bode magnitude plot ofa fiter having a transfer function 10's H(s)- (s+500) (s+S0s+2500) he following senilog graph to sketch yo ur plot (and please scale the eequeney axis proper a) Please use t receive full credits) b) What kind of filter is it and why? read the approximate 3-dB cut-off frequencies of the filter From your plot ont is the asrsximate.ostt of the filter due to an input, st)- 2sin(400)-3os(10 a) c) frequency axis properly a) Please...
 Prepare the Bode Plot of the following transfer function (show only the asymptotes Gls)-1,000 s (s 1)s+1000PV (s+10P (s+10011 The amplitude at w-0.1 rad/sec the slope between 0.1 rad/s and 1 rad/s db db/dec, db/dec the slope between 1 rad/s and 10 rad/s the slope between 10 rad/s and 100 rad/s db/dec db/dec the slope between 100 rad/s and 1,000 rad/s db/dec, the slope between 1,000 rad/s and 10,000 rad/s phase angle at 0.001 rad/s degrees, phase angle at 10,000...
 3. You are given the following Bode diagrams for different systems. Find the transfer function for each one of the systems considering the asymptotes and breaking points. 2.5 An C. - - - Magnitude (dB) Magnitude (dB) 10-1 100 101 10% 10° Frequency (rad/s) Frequency (rad/s) Magnitude (dB) Magnitude (dB) 100 101 101 Frequency (rad/s) 100 101 10² Frequency (rad/s) 103 104
 Chapter 12, Problem 12.21 (Multistep) Part 1 Correct. Sketch the magnitude characteristic of the Bode plot for the transfer function 30(0.060 * jo + 1) jojo + 1)(0.0024 * ja + 1) H0) = Shown here is the radian frequency axis for w > 0. The labeled frequencies represent the break frequencies in the transfer function H(o) (not necessarily drawn to scale). -+ W + w W3 W (rad/sec) What are the numerical values of the break frequencies w1, wz,...
Most questions answered within 3 hours.
-
Principles of Programming midterm study guide help!
1.)
______ Which of the following would reference the...
asked 4 minutes ago -
Romeo wishes to throw a bouquet of flowers to Juliet, who is on
a second-story balcony,...
asked 19 minutes ago -
Why is QE a controversial monetary policy tool.
A. It may lead to excessive inflation.B. By...
asked 35 minutes ago -
A finite potential well has depth U0 = 2.78 eV . What is the
penetration distance...
asked 1 hour ago -
1. The bus bars of a power station are in two sections A and B
separated...
asked 59 minutes ago -
Fiscal policy is the deliberate manipulation of taxes and
government spending to alter GDP, employment, inflation...
asked 1 hour ago -
evaluating an expression using only one digit and + and - as
operators ....3+5-1+7-5+8
-----------------------
stack...
asked 1 hour ago -
Two concentric current loops lie in the same plane. The smaller
loop has a radius of...
asked 2 hours ago -
1)Which of the following is an
important difference between qualified and nonqualified retirement
plans?
a. Qualified...
asked 2 hours ago -
What's the streaming business's problem on the
horizon?
asked 3 hours ago -
I need help with writing the conclusion for this online lab
report
Abstract
By testing the...
asked 3 hours ago -
For the reaction 1N2+3H2-----> 2NH3, would the reaction rate
trend be: delta[NH3]/ delta t = -2...
asked 4 hours ago