Medicare spending per patient in different U.S. metropolitan areas may differ. Based on the sample data...
Medicare spending per patient in different U.S. metropolitan areas may differ. Based on the sample data below, answer the questions that follow to determine whether the average spending in the northern region is significantly less than the average spending in the southern region at the 1 percent level.
| Northern Region | Southern Region | |
| Sample Mean | $4,327 | $6865 |
| Standard Deviation | 1476 | 3602 |
| Sample SIze | 11 | 15 |
| Significance | 1% |
(a-1) Choose the appropriate hypotheses. Assume μN is the average spending in the northern region and μS is the average spending in the southern region.
a. H0: μN − μS ≤ 0 versus H1: μN – μS >0
or
b. H0: μN − μS ≥ 0 versus H1: μN – μS < 0
(a-2) Specify the decision rule. (Do not use the quick rule to determine degrees of freedom. Round your answer to 3 decimal places. A negative value should be indicated by a minus sign.)
Reject the null hypothesis if tcalc < _________
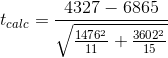
(b) Find the test statistic tcalc assuming unequal variances. (Round your answer to 2 decimal places. A negative value should be indicated by a minus sign.)
tcalc -2.46
(c-1) Can we reject the null hypothesis?
No, fail to reject the null hypothesis.
or
Yes, reject the null hypothesis.
(c-2) The average spending in the northern region is significantly less than the average spending in the southern region.
True/False?
Homework Answers
a-1) Hypothesis :
 i.e,
i.e, 
 i.e
i.e 
Left tailed test.
a-2)
Significance level = 1% = 0.01
degrees of freedom is given by,
![df =\frac{ \left [ \frac{s^2_1}{n_1} + \frac{s^2_2}{n_2} \right ]^2}{\frac{\left ( \frac{s^2_1}{n_1} \right )^2}{n_1 -1}+\frac{\left ( \frac{s^2_2}{n_2} \right )^2}{n_2 -1}}](http://img.homeworklib.com/questions/835fdbf0-c3f1-11ea-9c32-43332d0866b2.png?x-oss-process=image/resize,w_560)
We are given , s1 = 1476 , s2 = 3602 , n1 = 11 , n2 = 15
![df =\frac{ \left [ \frac{1476^2}{11} + \frac{3602^2}{15} \right ]^2}{\frac{\left ( \frac{1476^2}{11} \right )^2}{11 -1}+\frac{\left ( \frac{3602^2}{15} \right )^2}{15 -1}}](http://img.homeworklib.com/questions/83bc1d60-c3f1-11ea-8be6-bd7f746ebf02.png?x-oss-process=image/resize,w_560)

So , critical value for this left tailed test is,

{ using Excel function , =T.INV( 0.01 , 19.69931 ) = -2.539 }
Reject the null hypothesis if tcalc < -2.539
b )
Test statistic :


C-1 )
The rejection region for this left-tailed test is R = { t : t < - 2.539 }
It is observed that tcalc > -2.539
So, fail to reject the null hypothesis.
C-2)
false.
There is not enough evidence say that the average spending in the northern region is significantly less than the average spending in the southern region
Add Answer to:
Medicare spending per patient in different U.S. metropolitan
areas may differ. Based on the sample data...
A ski company in Vail owns two ski shops, one on the west side and one...
A ski company in Vail owns two ski shops, one on the west side and one on the east side of Vail. Ski hat sales data (in dollars) for a random sample of 5 Saturdays during the 2004 season showed the following results. Is there a significant difference in sales dollars of hats between the west side and east side stores at the 10 percent level of significance? Saturday Sales Data ($) for Ski Hats Saturday East Side Shop West...
Researchers at the Mayo Clinic have studied the effect of sound levels on patient healing and...
Researchers at the Mayo Clinic have studied the effect of sound levels on patient healing and have found a significant association (louder hospital ambient sound level is associated with slower postsurgical healing). Based on the Mayo Clinic's experience, Ardmore Hospital installed a new vinyl flooring that is supposed to reduce the mean sound level (decibels) in the hospital corridors. The sound level is measured at five randomly selected times in the main corridor. New Flooring Old Flooring 42 48 41...
#3 Given the following hypotheses: H0: μ = 520 H1: μ ≠ 520 A random sample...
#3 Given the following hypotheses: H0: μ = 520 H1: μ ≠ 520 A random sample of 18 observations is selected from a normal population. The sample mean was 529 and the sample standard deviation was 5. Using the 0.01 significance level: State the decision rule. (Negative amount should be indicated by a minus sign. Round your answers to 3 decimal places.) Compute the value of the test statistic. (Round your answer to 3 decimal places.) What is your decision...
A certain company will purchase the house of any employee who is transferred out of state and will handle all details of reselling the house. The purchase price is based on two assessments, one asses...
 A certain company will purchase the house of any employee who is transferred out of state and will handle all details of reselling the house. The purchase price is based on two assessments, one assessor being chosen by the employee and one by the company Based on the sample of eight assessments shown, do the two assessors agree? Use the 10 level of significance Assessments of Eight Homes ($ thousands) Assessed by Home 1 Home 2 Home 3 Company Employee...
A recent national survey found that high school students watched an average (mean) of 7.6 movies...
A recent national survey found that high school students watched an average (mean) of 7.6 movies per month with a population standard deviation of 0.5. The distribution of number of movies watched per month follows the normal distribution. A random sample of 41 college students revealed that the mean number of movies watched last month was 7.0. At the 0.05 significance level, can we conclude that college students watch fewer movies a month than high school students? State the null...
A recent national survey found that high school students watched an average (mean) of 7.1 movies...
A recent national survey found that high school students watched an average (mean) of 7.1 movies per month with a population standard deviation of 1.0. The distribution of number of movies watched per month follows the normal distribution. A random sample of 41 college students revealed that the mean number of movies watched last month was 6.6. At the 0.05 significance level, can we conclude that college students watch fewer movies a month than high school students? State the null...
A recent national survey found that high school students watched an average (mean) of 7.8 movies...
A recent national survey found that high school students watched an average (mean) of 7.8 movies per month with a population standard deviation of 0.5. The distribution of number of movies watched per month follows the normal distribution. A random sample of 30 college students revealed that the mean number of movies watched last month was 7.3. At the 0.05 significance level, can we conclude that college students watch fewer movies a month than high school students? State the null...
According to the Census Bureau, 3.36 people reside in the typical American household. A sample of...
According to the Census Bureau, 3.36 people reside in the typical American household. A sample of 27 households in Arizona retirement communities showed the mean number of residents per household was 2.70 residents. The standard deviation of this sample was 1.25 residents. At the .10 significance level, is it reasonable to conclude the mean number of residents in the retirement community household is less than 3.36 persons? a. State the null hypothesis and the alternate hypothesis. (Round your answer...
Required information [The following information applies to the questions displayed below.] A recent national survey found...
Required information [The following information applies to the questions displayed below.] A recent national survey found that high school students watched an average (mean) of 6.6 DVDs per month with a population standard deviation of 1.00 hour. The distribution of DVDs watched per month follows the normal distribution. A random sample of 30 college students revealed that the mean number of DVDs watched last month was 6.00. At the 0.05 significance level, can we conclude that college students watch fewer...
For a sample of 20 New England cities, a sociologist studies the crime rate in each...
For a sample of 20 New England cities, a sociologist studies the crime rate in each city (crimes per 100,000 residents) as a function of its poverty rate (in %) and its median income (in $1,000s). A portion of the regression results is shown in the accompanying table. Use Table 2 and Table 4. ANOVA df SS MS F Significance F Regression 2 2,517.3 1,258.6 7.49E-01 Residual 17 72,837.53 4,284.56 Total 19 75,354.80 Coefficients...
 A certain company will purchase the house of any employee who is transferred out of state and will handle all details of reselling the house. The purchase price is based on two assessments, one assessor being chosen by the employee and one by the company Based on the sample of eight assessments shown, do the two assessors agree? Use the 10 level of significance Assessments of Eight Homes ($ thousands) Assessed by Home 1 Home 2 Home 3 Company Employee...
Most questions answered within 3 hours.
-
A cylindrical cable with a resistivity of 1.6x10⁻⁸ Ω·m and cross
sectional area of 3x10⁻⁵ m^2...
asked 6 minutes ago -
True or False.
A consumer with convex preferences who is indifferent between
the bundles (5,2) and...
asked 9 minutes ago -
NADH passes electrons into the electron transport chain. List
the carriers that would receive the electrons,...
asked 6 minutes ago -
A diamond's index of refraction for red light, 656 nm, is 2.410,
while that for blue...
asked 22 minutes ago -
Compare HPLC, SPE, and GC. Identify the differences, the
advantages, and the weaknesses of each method.
asked 24 minutes ago -
Characteristic x-rays emitted by potassium have a wavelength of
0.374 nm. What is the energy of...
asked 26 minutes ago -
there is a function to create two random numbers between 1 and
25 and a function...
asked 44 minutes ago -
At a certain temperature, the ?pKp for the decomposition of
H2SH2S is 0.832.0.832.
H2S(g)↽−−⇀H2(g)+S(g)H2S(g)↽−−⇀H2(g)+S(g)
Initially, only...
asked 38 minutes ago -
Part 1.C&A Fast Food has four activities in serving a
customer: greet customer, take order, process...
asked 44 minutes ago -
Which attribute allows you to specify a custom "thumbnail" for
multimedia elements?
asked 1 hour ago -
How much 0.1200 M sodium hydroxide solution is need to titrate
14 mL of a 0.100...
asked 58 minutes ago -
An impulse is a change in momentum usually over
a short time. For which of the...
asked 1 hour ago