
Homework Answers
![Given @ +(2+ -6] steps follow 13 shifting > Scaling → Reversal xct-6) Right shift auct-6) 2 . . -- Scanned with CamScanner](http://img.homeworklib.com/questions/b8ab2680-c492-11ea-bece-23e3d2721464.png?x-oss-process=image/resize,w_560)


 if you have any doubt or need
more information please post it
if you have any doubt or need
more information please post it
Add Answer to:
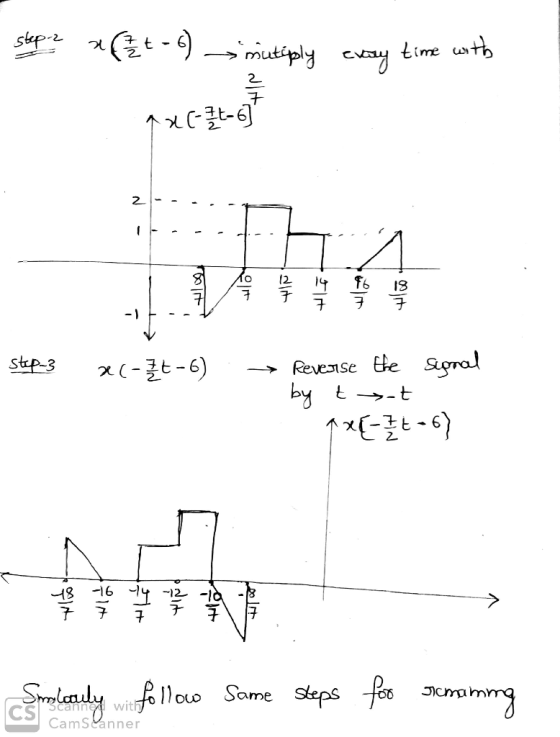
given the signs x(t) and h(t)
find and draw in detail each of the following
signals...
find the next Laplace transforms Parte 1: Encuentre las siguientes transformadas de Laplace (7 puntos cada uno) 1) L(e-t) 2) Lit e-t) 3) Licos2t) 4) Litcosv3t) 6) L- 8)じ 9) L-11 Parte 1: En...
 find the next Laplace transforms
Parte 1: Encuentre las siguientes transformadas de Laplace (7 puntos cada uno) 1) L(e-t) 2) Lit e-t) 3) Licos2t) 4) Litcosv3t) 6) L- 8)じ 9) L-11
Parte 1: Encuentre las siguientes transformadas de Laplace (7 puntos cada uno) 1) L(e-t) 2) Lit e-t) 3) Licos2t) 4) Litcosv3t)
6) L- 8)じ 9) L-11
find the next Laplace transforms
Parte 1: Encuentre las siguientes transformadas de Laplace (7 puntos cada uno) 1) L(e-t) 2) Lit e-t) 3) Licos2t) 4) Litcosv3t) 6) L- 8)じ 9) L-11
Parte 1: Encuentre las siguientes transformadas de Laplace (7 puntos cada uno) 1) L(e-t) 2) Lit e-t) 3) Licos2t) 4) Litcosv3t)
6) L- 8)じ 9) L-11
For every f(x) draw the graph. 4. Dibuje una gráfica de cada una de las siguientes...
 For
every f(x) draw the graph.
4. Dibuje una gráfica de cada una de las siguientes funciones: si x < -1 2. f(x) = {2 si x 20 si x <3 x + 4 six 3 c. f(x) = {3 - X si x > 2 (2x+3 si xs2 d. f(x) = v=x si *< 0 l-VX si x 20 c. f(x) = -1 sin sxsn +1,n par de otro modo wala (x - 1) si *<-1 si - 15x51...
For
every f(x) draw the graph.
4. Dibuje una gráfica de cada una de las siguientes funciones: si x < -1 2. f(x) = {2 si x 20 si x <3 x + 4 six 3 c. f(x) = {3 - X si x > 2 (2x+3 si xs2 d. f(x) = v=x si *< 0 l-VX si x 20 c. f(x) = -1 sin sxsn +1,n par de otro modo wala (x - 1) si *<-1 si - 15x51...
como pueden diferenciarse las espectroscopia de IR los siguientes compuestos? indique las bandas de absorcion carasteristicas...
 como pueden diferenciarse las espectroscopia de IR los
siguientes compuestos? indique las bandas de absorcion
carasteristicas previstas para cada uno de ellos
How can IR spectroscopy differentiate the following compounds?
indicate the expected characteristic absorption bands for each of
them
identify the signals of the compounds
1. ¿Cómo pueden diferenciarse mediante la espectroscopia de IR los siguientes compuestos? Indique las bandas de absorción características previstas para cada uno de ellos. iy 2x2 x. x 1 / 2 +1=3 2. Identificar...
como pueden diferenciarse las espectroscopia de IR los
siguientes compuestos? indique las bandas de absorcion
carasteristicas previstas para cada uno de ellos
How can IR spectroscopy differentiate the following compounds?
indicate the expected characteristic absorption bands for each of
them
identify the signals of the compounds
1. ¿Cómo pueden diferenciarse mediante la espectroscopia de IR los siguientes compuestos? Indique las bandas de absorción características previstas para cada uno de ellos. iy 2x2 x. x 1 / 2 +1=3 2. Identificar...
10- Given the infrared spectrum, choose what structures are most suitable for it. Justify your answer by indicating the links responsible for the removals in the following Frequencies Indicate the ty...
 10-
Given the infrared spectrum, choose what structures are most
suitable for it.
Justify your answer by indicating the links responsible for
the removals in the following
Frequencies Indicate the type of link with the hybridization
and the type of vibrational mode.
11-Given the following proton NMR spectrum, choose the
appropriate compound and assign the signals from the spectrum with
a group of protons in the structure.
10. Dado el espectro de infrarrojo escoja cuál de las estructuras es la...
10-
Given the infrared spectrum, choose what structures are most
suitable for it.
Justify your answer by indicating the links responsible for
the removals in the following
Frequencies Indicate the type of link with the hybridization
and the type of vibrational mode.
11-Given the following proton NMR spectrum, choose the
appropriate compound and assign the signals from the spectrum with
a group of protons in the structure.
10. Dado el espectro de infrarrojo escoja cuál de las estructuras es la...
Draw the graphs of the following forms of f(t) Dibuje las gráficas de las siguientes formas...
 Draw the graphs of the following forms of f(t)
Dibuje las gráficas de las siguientes formas de f(t): (a) f(t) – f(t)U(t –1) (b) f(t – 2) U(t – 2) (c) f(t)U(t – 2) (d) f(t) – f(t) U(t – 2) (e) f(t) U(t – 1.) – f(t) U(t – 3) (f) f(t – 2)U(t – 2) – f(t – 2) U(t – 4)
Draw the graphs of the following forms of f(t)
Dibuje las gráficas de las siguientes formas de f(t): (a) f(t) – f(t)U(t –1) (b) f(t – 2) U(t – 2) (c) f(t)U(t – 2) (d) f(t) – f(t) U(t – 2) (e) f(t) U(t – 1.) – f(t) U(t – 3) (f) f(t – 2)U(t – 2) – f(t – 2) U(t – 4)
15. Find the equation of the line parallel to y = -5/2 x + 6 that...
 15. Find the equation of the line parallel to y = -5/2 x + 6
that passes through the point (-2,1)
16. Find the equation of the line that passes through (4,5)
and that is perpendicular to the line y = 3/2 x -4
17. The figure to the side represents a sidewalk structure.
measurements are in meters. If beam A is perpendicular to beam B,
find the size of beam C.
18. For each of the following equations, determine...
15. Find the equation of the line parallel to y = -5/2 x + 6
that passes through the point (-2,1)
16. Find the equation of the line that passes through (4,5)
and that is perpendicular to the line y = 3/2 x -4
17. The figure to the side represents a sidewalk structure.
measurements are in meters. If beam A is perpendicular to beam B,
find the size of beam C.
18. For each of the following equations, determine...
20. Calculates the radius of convergence of each of the power series and what is the...
 20.
Calculates the radius of convergence of each of the power series
and what is the behavior at the extremes of the convergence
intervals in the following cases
20. Calcula el radio de convergencia de cada una de las series de potenciasx". y estudia el comportamiento de la serie en los extremos del intervalo de convergencia, en los siguientes casos: b) (n+1)j+1, c) =e- (1+) e)cn= a n-n a) ca n1. 1-3-5.(2n+1) d) en= 2.4.6..-(2n + 2) n! (a>0),
20.
Calculates the radius of convergence of each of the power series
and what is the behavior at the extremes of the convergence
intervals in the following cases
20. Calcula el radio de convergencia de cada una de las series de potenciasx". y estudia el comportamiento de la serie en los extremos del intervalo de convergencia, en los siguientes casos: b) (n+1)j+1, c) =e- (1+) e)cn= a n-n a) ca n1. 1-3-5.(2n+1) d) en= 2.4.6..-(2n + 2) n! (a>0),
Let the function f(t) be define as shown in the first photo, Draw the following graphs...
 Let the function f(t) be define as shown in the first
photo, Draw the following graphs for f(t)
f(t) = ((t - 1)2 + 1, 0 <t< 2 t, 2 <t <3 -(t – 4)2 + 4, t> 3 Dibuje las gráficas de las siguientes formas de f(t): (a) f(t) – f(t) U(t –1) (b) f(t – 2)U(t – 2) (c) f(t)U(t – 2) (d) f(t) – f(t)U(t – 2) (e) f(t) U(t – 1.) – f(t) U(t – 3)...
Let the function f(t) be define as shown in the first
photo, Draw the following graphs for f(t)
f(t) = ((t - 1)2 + 1, 0 <t< 2 t, 2 <t <3 -(t – 4)2 + 4, t> 3 Dibuje las gráficas de las siguientes formas de f(t): (a) f(t) – f(t) U(t –1) (b) f(t – 2)U(t – 2) (c) f(t)U(t – 2) (d) f(t) – f(t)U(t – 2) (e) f(t) U(t – 1.) – f(t) U(t – 3)...
el coeficiente de correlación rny nos indica a. La fortaleza de la relación b. La c. La presencia de outliers en el eje de Y d. La naturaleza de la relación que X causa camblos en Y e. Ninguna de...
 el coeficiente de correlación rny nos indica a. La fortaleza de la relación b. La c. La presencia de outliers en el eje de Y d. La naturaleza de la relación que X causa camblos en Y e. Ninguna de las anteriores. cuál de las siguientes aseveracones cuadrática entre X, Y cercanía de los datos a la ecuación lineal entre X, Y se una desviación estándar s. Si una observación es tres veces el promedio (a saca de la muestra,...
 find the next Laplace transforms
Parte 1: Encuentre las siguientes transformadas de Laplace (7 puntos cada uno) 1) L(e-t) 2) Lit e-t) 3) Licos2t) 4) Litcosv3t) 6) L- 8)じ 9) L-11
Parte 1: Encuentre las siguientes transformadas de Laplace (7 puntos cada uno) 1) L(e-t) 2) Lit e-t) 3) Licos2t) 4) Litcosv3t)
6) L- 8)じ 9) L-11
find the next Laplace transforms
Parte 1: Encuentre las siguientes transformadas de Laplace (7 puntos cada uno) 1) L(e-t) 2) Lit e-t) 3) Licos2t) 4) Litcosv3t) 6) L- 8)じ 9) L-11
Parte 1: Encuentre las siguientes transformadas de Laplace (7 puntos cada uno) 1) L(e-t) 2) Lit e-t) 3) Licos2t) 4) Litcosv3t)
6) L- 8)じ 9) L-11
 For
every f(x) draw the graph.
4. Dibuje una gráfica de cada una de las siguientes funciones: si x < -1 2. f(x) = {2 si x 20 si x <3 x + 4 six 3 c. f(x) = {3 - X si x > 2 (2x+3 si xs2 d. f(x) = v=x si *< 0 l-VX si x 20 c. f(x) = -1 sin sxsn +1,n par de otro modo wala (x - 1) si *<-1 si - 15x51...
For
every f(x) draw the graph.
4. Dibuje una gráfica de cada una de las siguientes funciones: si x < -1 2. f(x) = {2 si x 20 si x <3 x + 4 six 3 c. f(x) = {3 - X si x > 2 (2x+3 si xs2 d. f(x) = v=x si *< 0 l-VX si x 20 c. f(x) = -1 sin sxsn +1,n par de otro modo wala (x - 1) si *<-1 si - 15x51...
 como pueden diferenciarse las espectroscopia de IR los
siguientes compuestos? indique las bandas de absorcion
carasteristicas previstas para cada uno de ellos
How can IR spectroscopy differentiate the following compounds?
indicate the expected characteristic absorption bands for each of
them
identify the signals of the compounds
1. ¿Cómo pueden diferenciarse mediante la espectroscopia de IR los siguientes compuestos? Indique las bandas de absorción características previstas para cada uno de ellos. iy 2x2 x. x 1 / 2 +1=3 2. Identificar...
como pueden diferenciarse las espectroscopia de IR los
siguientes compuestos? indique las bandas de absorcion
carasteristicas previstas para cada uno de ellos
How can IR spectroscopy differentiate the following compounds?
indicate the expected characteristic absorption bands for each of
them
identify the signals of the compounds
1. ¿Cómo pueden diferenciarse mediante la espectroscopia de IR los siguientes compuestos? Indique las bandas de absorción características previstas para cada uno de ellos. iy 2x2 x. x 1 / 2 +1=3 2. Identificar...
 10-
Given the infrared spectrum, choose what structures are most
suitable for it.
Justify your answer by indicating the links responsible for
the removals in the following
Frequencies Indicate the type of link with the hybridization
and the type of vibrational mode.
11-Given the following proton NMR spectrum, choose the
appropriate compound and assign the signals from the spectrum with
a group of protons in the structure.
10. Dado el espectro de infrarrojo escoja cuál de las estructuras es la...
10-
Given the infrared spectrum, choose what structures are most
suitable for it.
Justify your answer by indicating the links responsible for
the removals in the following
Frequencies Indicate the type of link with the hybridization
and the type of vibrational mode.
11-Given the following proton NMR spectrum, choose the
appropriate compound and assign the signals from the spectrum with
a group of protons in the structure.
10. Dado el espectro de infrarrojo escoja cuál de las estructuras es la...
 Draw the graphs of the following forms of f(t)
Dibuje las gráficas de las siguientes formas de f(t): (a) f(t) – f(t)U(t –1) (b) f(t – 2) U(t – 2) (c) f(t)U(t – 2) (d) f(t) – f(t) U(t – 2) (e) f(t) U(t – 1.) – f(t) U(t – 3) (f) f(t – 2)U(t – 2) – f(t – 2) U(t – 4)
Draw the graphs of the following forms of f(t)
Dibuje las gráficas de las siguientes formas de f(t): (a) f(t) – f(t)U(t –1) (b) f(t – 2) U(t – 2) (c) f(t)U(t – 2) (d) f(t) – f(t) U(t – 2) (e) f(t) U(t – 1.) – f(t) U(t – 3) (f) f(t – 2)U(t – 2) – f(t – 2) U(t – 4)
 15. Find the equation of the line parallel to y = -5/2 x + 6
that passes through the point (-2,1)
16. Find the equation of the line that passes through (4,5)
and that is perpendicular to the line y = 3/2 x -4
17. The figure to the side represents a sidewalk structure.
measurements are in meters. If beam A is perpendicular to beam B,
find the size of beam C.
18. For each of the following equations, determine...
15. Find the equation of the line parallel to y = -5/2 x + 6
that passes through the point (-2,1)
16. Find the equation of the line that passes through (4,5)
and that is perpendicular to the line y = 3/2 x -4
17. The figure to the side represents a sidewalk structure.
measurements are in meters. If beam A is perpendicular to beam B,
find the size of beam C.
18. For each of the following equations, determine...
 20.
Calculates the radius of convergence of each of the power series
and what is the behavior at the extremes of the convergence
intervals in the following cases
20. Calcula el radio de convergencia de cada una de las series de potenciasx". y estudia el comportamiento de la serie en los extremos del intervalo de convergencia, en los siguientes casos: b) (n+1)j+1, c) =e- (1+) e)cn= a n-n a) ca n1. 1-3-5.(2n+1) d) en= 2.4.6..-(2n + 2) n! (a>0),
20.
Calculates the radius of convergence of each of the power series
and what is the behavior at the extremes of the convergence
intervals in the following cases
20. Calcula el radio de convergencia de cada una de las series de potenciasx". y estudia el comportamiento de la serie en los extremos del intervalo de convergencia, en los siguientes casos: b) (n+1)j+1, c) =e- (1+) e)cn= a n-n a) ca n1. 1-3-5.(2n+1) d) en= 2.4.6..-(2n + 2) n! (a>0),
 Let the function f(t) be define as shown in the first
photo, Draw the following graphs for f(t)
f(t) = ((t - 1)2 + 1, 0 <t< 2 t, 2 <t <3 -(t – 4)2 + 4, t> 3 Dibuje las gráficas de las siguientes formas de f(t): (a) f(t) – f(t) U(t –1) (b) f(t – 2)U(t – 2) (c) f(t)U(t – 2) (d) f(t) – f(t)U(t – 2) (e) f(t) U(t – 1.) – f(t) U(t – 3)...
Let the function f(t) be define as shown in the first
photo, Draw the following graphs for f(t)
f(t) = ((t - 1)2 + 1, 0 <t< 2 t, 2 <t <3 -(t – 4)2 + 4, t> 3 Dibuje las gráficas de las siguientes formas de f(t): (a) f(t) – f(t) U(t –1) (b) f(t – 2)U(t – 2) (c) f(t)U(t – 2) (d) f(t) – f(t)U(t – 2) (e) f(t) U(t – 1.) – f(t) U(t – 3)...
 el coeficiente de correlación rny nos indica a. La fortaleza de la relación b. La c. La presencia de outliers en el eje de Y d. La naturaleza de la relación que X causa camblos en Y e. Ninguna de las anteriores. cuál de las siguientes aseveracones cuadrática entre X, Y cercanía de los datos a la ecuación lineal entre X, Y se una desviación estándar s. Si una observación es tres veces el promedio (a saca de la muestra,...
Most questions answered within 3 hours.
-
Under the influence of its drive force, a snowmobile is moving
at a constant velocity along...
asked 1 hour ago -
Why do organizations decline? What steps can top
management take to halt, decline, and restore organizational...
asked 56 minutes ago -
. Suppose a discrete random variable has probability
distribution
P(x) = .2 if x = 0...
asked 42 minutes ago -
What mechanisms Drive speciation??
(I.e. what was Dawins theory on the orgin of species, and how...
asked 2 hours ago -
The manager at a car assembly plant believes that the mean
assembly time for a car...
asked 3 hours ago -
Which of the following is true of electron capture?
A) It decreases the nuclide's mass number...
asked 5 hours ago -
Assuming an efficiency of 43.10%, calculate the actual yield of
magnesium nitrate formed from 114.9 g...
asked 5 hours ago -
The highly pathogenic bacterium Clostridium
perfringens causes gangrene, a disease that results in the
destruction of...
asked 7 hours ago -
In the context of situation analysis, which of the following is
a category for analysis in...
asked 7 hours ago -
In a study of the gas phase decomposition of sulfuryl chloride
at 600 K SO2Cl2(g)SO2(g) +...
asked 7 hours ago -
75 g of 2-propanol (C3H8O) and 25 g of pentane are mixed in a
200 mL...
asked 7 hours ago -
The 2800-turn coil in a dc motor has an area per turn of 1.1 ×
10-2...
asked 7 hours ago