Table 3.1
|
Time, t (s) |
Position, x (m) |
tn/t1 |
Time Squared, t^2 (s^2) |
(tn)^2/(t1)^2 |
xn/x1 |
|
t1, 0.40 |
x1, 0.25 |
1.0 |
.16 |
1 |
1 |
|
t2, 0.80 |
x2, 0.36 |
2.0 |
.64 |
4 |
1.4 |
|
t3, 1.2 |
x3, 0.52 |
3.0 |
1.4 |
9 |
2.1 |
|
t4, 1.6 |
x4, 0.71 |
4.0 |
2.6 |
16 |
2.8 |
|
t5, 2.0 |
x5, 0.95 |
5.0 |
4.0 |
25 |
3.8 |
|
t6, 2.4 |
x6, 1.2 |
6.0 |
5.8 |
36 |
4.8 |
Linear fit equation for Position Vs. Time: 0.545x - 0.0530
Quadratic fit equation for Position Vs. Time: 0.123x^2 +0.138 +0.178
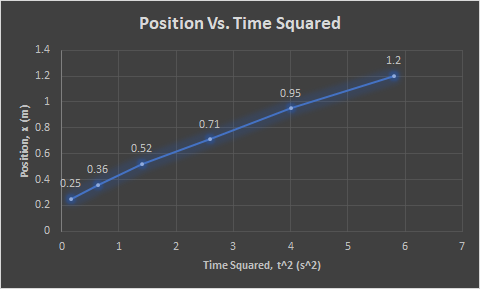
Table 3.2
|
Time |
Position/ velocity |
vn/v1 |
|
t1, 0.45 |
v1, 0.24 |
1 |
|
t2, 0.95 |
v2, 0.37 |
1.5 |
|
t3, 1.4 |
v3, 0.48 |
2 |
|
t4, 1.9 |
v4, 0.61 |
2.5 |
Slope of the graph: 0.246 units idk
Question: By determining a percent difference, compare the accelartion of the car determined from the graph plotted in step 5 to that measured as the slope of the velocity graph?

Homework Answers
https://drive.google.com/file/d/1AmiFI9AhdteR5vl-FOZpDllNa_8lRHhq/view?usp=drivesdk

Add Answer to:
Table 3.1
Time, t (s)
Position, x (m)
tn/t1
Time Squared, t^2 (s^2)
(tn)^2/(t1)^2
xn/x1
t1,...
Please note that X is time Value Position vs Time Linear Fit m y = mx...
 Please note that X is
time
Value Position vs Time Linear Fit m y = mx + b Quadratic Fit Α. B 0.305 -0.0583 y=0.305x -0.0583 4 1 0.110 -0.0663 0.195... yöllx'-0.0663x7.195 |(1.550, 0.359) 1(1.600,0.373) 0.28 y = Ax?+ Bx + C (x1, yı) (x2, Y2) Slope For Position vs Time data: (a) Did your quadratic fit of this graph provide initial position? If yes, what is its value? (4 points) (b) Did your quadratic fit of this graph provide...
Please note that X is
time
Value Position vs Time Linear Fit m y = mx + b Quadratic Fit Α. B 0.305 -0.0583 y=0.305x -0.0583 4 1 0.110 -0.0663 0.195... yöllx'-0.0663x7.195 |(1.550, 0.359) 1(1.600,0.373) 0.28 y = Ax?+ Bx + C (x1, yı) (x2, Y2) Slope For Position vs Time data: (a) Did your quadratic fit of this graph provide initial position? If yes, what is its value? (4 points) (b) Did your quadratic fit of this graph provide...
HELP NEEDED!!!!!!! especially with the graphing for objects 1 and 2 together and object 3 squared. People are getting different graphs and I do not know if it is correct. Also SIG FIGS in analysis. TH...
 HELP NEEDED!!!!!!! especially with the graphing for objects 1
and 2 together and object 3 squared. People are getting different
graphs and I do not know if it is correct. Also SIG FIGS in
analysis. THANK YOU IN ADVANCE
Part 1 - Velocity Position versus Time (x vs t) graph for Object 1 x versust-Object 1 y 1.2754x+ 0.0187 x (m) Linear (x (m)) 0 Position versus Time (x vs t) graph for Object 2 x versus t-Object 2 4.5...
HELP NEEDED!!!!!!! especially with the graphing for objects 1
and 2 together and object 3 squared. People are getting different
graphs and I do not know if it is correct. Also SIG FIGS in
analysis. THANK YOU IN ADVANCE
Part 1 - Velocity Position versus Time (x vs t) graph for Object 1 x versust-Object 1 y 1.2754x+ 0.0187 x (m) Linear (x (m)) 0 Position versus Time (x vs t) graph for Object 2 x versus t-Object 2 4.5...
PHY 1100- Exercise 2- Report Name: Part 1 -Velocity Position versus Time (x vs t0 graph...
 PHY 1100- Exercise 2- Report Name: Part 1 -Velocity Position versus Time (x vs t0 graph for Object 1 x versus t- Object 1 y 1.2754x+0.0187 Linear (x) t(s) Position versus Time (x vs t) graph for Object 2 x versus t- Object 2 4.5 3.5 -0.7249x+0.0513 2.5 Linear () 1.5 0.5 t (s) Position versus Time (x vs t) graph for Both Objects x versus t for Both Objects y 0.7652x+0.0187 Linear (x) -0.4349x+0.0513 0.6 12 1.8 2.4 3...
(I) Let's start with very simple data table 1.0 2.0 3.0 4.0 5.0 6.0 -1 ±...
 (I) Let's start with very simple data table 1.0 2.0 3.0 4.0 5.0 6.0 -1 ± 1.8 4±2.0 9+ 1.0 14 + 0.8 19 s 0.8 24 + 1.2 2% 1.8 34 ± 2.0 7.0 8.0 9.0 1. Plot a graph of y vs. X on a piece of graph paper 2. Is it a straight line? Draw the best-fit line. 3. Compute the slope and y-intercept for this line. Write the equation for y in terms of x using...
Velocity v (m/s) v/t (unit= 2 Time t(s) 10.1004 10.3006 0.5008 0.7011 0.9014 1.1017 11.3021 1.5026...
 Velocity v (m/s) v/t (unit= 2 Time t(s) 10.1004 10.3006 0.5008 0.7011 0.9014 1.1017 11.3021 1.5026 Position x (m) 0.149 0.195. 6.271 0.366 0.474 0.599 0.735 0.881 5 0.305 10.427 0.507 10.592 10.651 0 103 1.013624 0.95268 0.722778 0.64 5249 0.591232 0.540218 8 3. calculate w/t (what are the units) and write it in column 5 of the table above Calculate its average and its uncertainty (with units): Average: >0.728 m 1x uncertainty: N e ma max- () mun =...
 Please note that X is
time
Value Position vs Time Linear Fit m y = mx + b Quadratic Fit Α. B 0.305 -0.0583 y=0.305x -0.0583 4 1 0.110 -0.0663 0.195... yöllx'-0.0663x7.195 |(1.550, 0.359) 1(1.600,0.373) 0.28 y = Ax?+ Bx + C (x1, yı) (x2, Y2) Slope For Position vs Time data: (a) Did your quadratic fit of this graph provide initial position? If yes, what is its value? (4 points) (b) Did your quadratic fit of this graph provide...
Please note that X is
time
Value Position vs Time Linear Fit m y = mx + b Quadratic Fit Α. B 0.305 -0.0583 y=0.305x -0.0583 4 1 0.110 -0.0663 0.195... yöllx'-0.0663x7.195 |(1.550, 0.359) 1(1.600,0.373) 0.28 y = Ax?+ Bx + C (x1, yı) (x2, Y2) Slope For Position vs Time data: (a) Did your quadratic fit of this graph provide initial position? If yes, what is its value? (4 points) (b) Did your quadratic fit of this graph provide...
 HELP NEEDED!!!!!!! especially with the graphing for objects 1
and 2 together and object 3 squared. People are getting different
graphs and I do not know if it is correct. Also SIG FIGS in
analysis. THANK YOU IN ADVANCE
Part 1 - Velocity Position versus Time (x vs t) graph for Object 1 x versust-Object 1 y 1.2754x+ 0.0187 x (m) Linear (x (m)) 0 Position versus Time (x vs t) graph for Object 2 x versus t-Object 2 4.5...
HELP NEEDED!!!!!!! especially with the graphing for objects 1
and 2 together and object 3 squared. People are getting different
graphs and I do not know if it is correct. Also SIG FIGS in
analysis. THANK YOU IN ADVANCE
Part 1 - Velocity Position versus Time (x vs t) graph for Object 1 x versust-Object 1 y 1.2754x+ 0.0187 x (m) Linear (x (m)) 0 Position versus Time (x vs t) graph for Object 2 x versus t-Object 2 4.5...
 PHY 1100- Exercise 2- Report Name: Part 1 -Velocity Position versus Time (x vs t0 graph for Object 1 x versus t- Object 1 y 1.2754x+0.0187 Linear (x) t(s) Position versus Time (x vs t) graph for Object 2 x versus t- Object 2 4.5 3.5 -0.7249x+0.0513 2.5 Linear () 1.5 0.5 t (s) Position versus Time (x vs t) graph for Both Objects x versus t for Both Objects y 0.7652x+0.0187 Linear (x) -0.4349x+0.0513 0.6 12 1.8 2.4 3...
 (I) Let's start with very simple data table 1.0 2.0 3.0 4.0 5.0 6.0 -1 ± 1.8 4±2.0 9+ 1.0 14 + 0.8 19 s 0.8 24 + 1.2 2% 1.8 34 ± 2.0 7.0 8.0 9.0 1. Plot a graph of y vs. X on a piece of graph paper 2. Is it a straight line? Draw the best-fit line. 3. Compute the slope and y-intercept for this line. Write the equation for y in terms of x using...
 Velocity v (m/s) v/t (unit= 2 Time t(s) 10.1004 10.3006 0.5008 0.7011 0.9014 1.1017 11.3021 1.5026 Position x (m) 0.149 0.195. 6.271 0.366 0.474 0.599 0.735 0.881 5 0.305 10.427 0.507 10.592 10.651 0 103 1.013624 0.95268 0.722778 0.64 5249 0.591232 0.540218 8 3. calculate w/t (what are the units) and write it in column 5 of the table above Calculate its average and its uncertainty (with units): Average: >0.728 m 1x uncertainty: N e ma max- () mun =...
Most questions answered within 3 hours.
-
The free energy change for the following reaction at 25 °C, when
[Sn2+] = 1.17 M...
asked 17 minutes ago -
An MNE is this kind of industry when competition in one country
is essentially independent of...
asked 1 hour ago -
. For this set of questions, determine what
proportion of a normal distribution is located betweeneach...
asked 2 hours ago -
A college student is employed as a door-to-door newspaper
salesman. Historical data suggests that the student...
asked 3 hours ago -
MATLAB HW 11 problem using Switch Case and Input commands
Write a script file that calculates...
asked 3 hours ago -
Considering gravitational time dilation, calculate the time that
passes in Earth’s surface while 1 hour passes...
asked 3 hours ago -
Minitab Problem: Take the Lake Hume June rainfall data and find
use the processes outlined in...
asked 4 hours ago -
X Company is trying to decide whether to continue using old
equipment to make Product A...
asked 4 hours ago -
IN PYTHON ONLY !! Program 2: Re-work
program #5 (WeeklyHours) from the previous assignment such that...
asked 5 hours ago -
The average length of time between arrivals at a turnpike
toll-booth is 26 seconds. What is...
asked 6 hours ago -
(a) A piston at 6.1 atm contains a gas that occupies a volume of
3.5 L....
asked 8 hours ago -
Please answer true or false. Words
cannot be changed or added in to make it true...
asked 8 hours ago