

Homework Answers
Add Answer to:
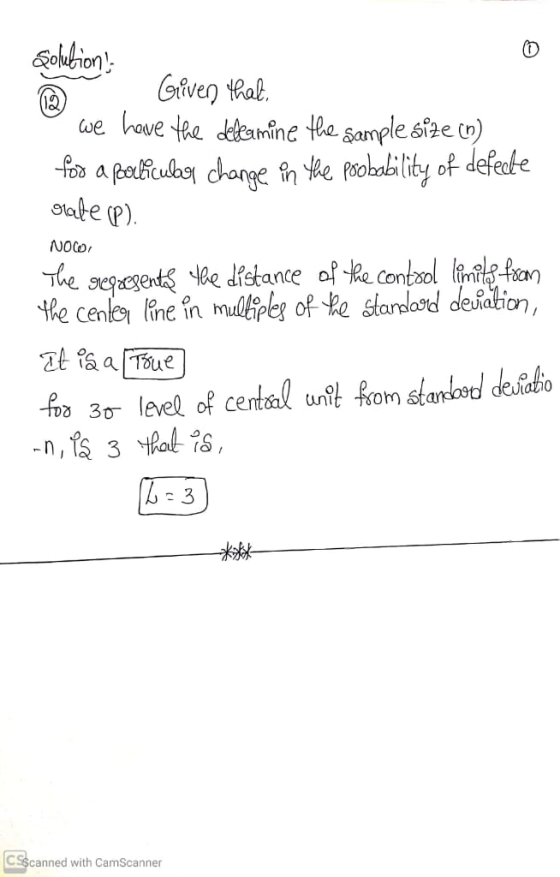
True or false and why
the
equation is in the picture below
The above equation is...
A control chart is used for monitoring a process meanl (X) that is normally distributed with a mean of μ and a standard...
 A control chart is used for monitoring a process meanl (X) that is normally distributed with a mean of μ and a standard deviation of σχ , and the sample size is n-5. А 3-sigma limit (μ ±30% ) is used as control limits. Two decision rules are given here. Rule 1: If one or more of the next seven samples yield values of the sample average that fall outside the control limits, conclude that the process is out of...
A control chart is used for monitoring a process mean ( 7 ) that is normally...
 A control chart is used for monitoring a process mean ( 7 ) that is normally distributed with a mean of u and a standard deviation of o, and the sample size is n = 5. A 3-sigma limit (u +30z) is used as control limits. Two decision rules are given here. Rule 1: If one or more of the next seven samples yield values of the sample average that fall outside the control limits, conclude that the process is...
i dont have any more informafoon to add besides rhis pther example of tne type of...
 i
dont have any more informafoon to add besides rhis pther example of
tne type of problem
0405/20 1:47 Homework: Chapter S6 Homework Score: 0 of 1 pt + 2 of 7 (4 complete) Problem 6s.16 HW Score: 46.43%, 3.25 of The defect rate for your product has historically been about 1.00%. For a sample size of 400, the upper and lower 3-sigma control chart limits are: Question Help UCL = enter your response as a number between 0 and...
i
dont have any more informafoon to add besides rhis pther example of
tne type of problem
0405/20 1:47 Homework: Chapter S6 Homework Score: 0 of 1 pt + 2 of 7 (4 complete) Problem 6s.16 HW Score: 46.43%, 3.25 of The defect rate for your product has historically been about 1.00%. For a sample size of 400, the upper and lower 3-sigma control chart limits are: Question Help UCL = enter your response as a number between 0 and...
that was the complete data the second picture is the control limits Refer to Table S61...
 that was the complete data the second picture is the control
limits
Refer to Table S61 - Factors for Computing Control Chart Limits (3 sigma) for this problem. Ross Hopkins is attempting to monitor a filling process that has an overall average of 705 mL. The average range R is 8 ml. For a sample size of 10, the control limits for 3-sigma x chart are: Upper Control Limit (UCL.2)= ml (round your response to three decimal places). Lower Control...
that was the complete data the second picture is the control
limits
Refer to Table S61 - Factors for Computing Control Chart Limits (3 sigma) for this problem. Ross Hopkins is attempting to monitor a filling process that has an overall average of 705 mL. The average range R is 8 ml. For a sample size of 10, the control limits for 3-sigma x chart are: Upper Control Limit (UCL.2)= ml (round your response to three decimal places). Lower Control...
8.4 14 *9. Suppose that we are using an T-chart with subgroups of size n -...
 8.4 14 *9. Suppose that we are using an T-chart with subgroups of size n - 5 in an idealized setting in which the data is Normally distributed with known mean μ and standard deviation σ. We know that σ,-sd(X)-4. Use also the facts that and Assume that the process is under control and that subgroups are indepen- dent. Suppose that 100 subgroup means are plotted onto the chart over the course of a day. (a) What is the probability...
Question 1 to 11, True or False? Applied business statistics 1) The width of the confidence...
 Question 1 to 11, True or False? Applied business statistics
1) The width of the confidence interval depends only on the desired level of confidence 2) When population standard deviation is unknown, sample standaird deviation is used and the interval estimation is based on values from the t- rather than the z-distribution n 3) The z value for a 98% confidence interval around the point estimate is 2.33 4) In order to construct a 90% confidence interval for the population...
Question 1 to 11, True or False? Applied business statistics
1) The width of the confidence interval depends only on the desired level of confidence 2) When population standard deviation is unknown, sample standaird deviation is used and the interval estimation is based on values from the t- rather than the z-distribution n 3) The z value for a 98% confidence interval around the point estimate is 2.33 4) In order to construct a 90% confidence interval for the population...
Section Two (True/False) Regarding SPC and control charts: 3. Control limits and specification limits are both...
 Section Two (True/False) Regarding SPC and control charts: 3. Control limits and specification limits are both provided by the customer. cause variation SPC uses graphed statics to determine if a process has special Control limits for most control charts are set at 2 standard deviations. If a control chart signals special cause variation, the cause will also be known. One should work on reducing common cause variation while eliminating special cause variation. Critical process outputs that are measured on a...
Piston rings for an automotive engine are produced by a forging process. We wish to monitor...
 Piston rings for an automotive engine are produced by a forging
process. We wish to monitor the inside diameter of the rings
manufactured by this process, using an x̄ and an s control chart.
Samples of size 8 are to be taken at regular intervals, and the
sample means and standard deviations are computed and plotted on
the charts in time order. The target values for the inside diameter
are a mean of μ = 75 mm and a standard...
Piston rings for an automotive engine are produced by a forging
process. We wish to monitor the inside diameter of the rings
manufactured by this process, using an x̄ and an s control chart.
Samples of size 8 are to be taken at regular intervals, and the
sample means and standard deviations are computed and plotted on
the charts in time order. The target values for the inside diameter
are a mean of μ = 75 mm and a standard...
1. A process that makes chocolate candy bars has an output that is normally distributed with...
1. A process that makes chocolate candy bars has an output that is normally distributed with a mean of 6 ounces and a standard deviation of .01 ounces. A job is to be run that requires 200 candy bars. Determine the three-sigma control limits for an x-bar chart, assuming a sample size of 10. If specifications are 5.98 to 6.02, what run size should be used for this job so that the expected number of good candy bars is 200,...
2. (2 True-False. Just say whether each statement is True or False – no need to justify...
2. (2 True-False. Just say whether each statement is True or False – no need to justify your answer. 1. If the number of trials in the binomial distribution increases by 1 (and P equals .50), the probability of getting either of the most extreme possible outcomes (that is, 0 or N) is cut in half. 2. If the number of trials in the binomial distribution increases by 1 (and P does not equal .50), the probability of getting either of...
 A control chart is used for monitoring a process meanl (X) that is normally distributed with a mean of μ and a standard deviation of σχ , and the sample size is n-5. А 3-sigma limit (μ ±30% ) is used as control limits. Two decision rules are given here. Rule 1: If one or more of the next seven samples yield values of the sample average that fall outside the control limits, conclude that the process is out of...
 A control chart is used for monitoring a process mean ( 7 ) that is normally distributed with a mean of u and a standard deviation of o, and the sample size is n = 5. A 3-sigma limit (u +30z) is used as control limits. Two decision rules are given here. Rule 1: If one or more of the next seven samples yield values of the sample average that fall outside the control limits, conclude that the process is...
 i
dont have any more informafoon to add besides rhis pther example of
tne type of problem
0405/20 1:47 Homework: Chapter S6 Homework Score: 0 of 1 pt + 2 of 7 (4 complete) Problem 6s.16 HW Score: 46.43%, 3.25 of The defect rate for your product has historically been about 1.00%. For a sample size of 400, the upper and lower 3-sigma control chart limits are: Question Help UCL = enter your response as a number between 0 and...
i
dont have any more informafoon to add besides rhis pther example of
tne type of problem
0405/20 1:47 Homework: Chapter S6 Homework Score: 0 of 1 pt + 2 of 7 (4 complete) Problem 6s.16 HW Score: 46.43%, 3.25 of The defect rate for your product has historically been about 1.00%. For a sample size of 400, the upper and lower 3-sigma control chart limits are: Question Help UCL = enter your response as a number between 0 and...
 that was the complete data the second picture is the control
limits
Refer to Table S61 - Factors for Computing Control Chart Limits (3 sigma) for this problem. Ross Hopkins is attempting to monitor a filling process that has an overall average of 705 mL. The average range R is 8 ml. For a sample size of 10, the control limits for 3-sigma x chart are: Upper Control Limit (UCL.2)= ml (round your response to three decimal places). Lower Control...
that was the complete data the second picture is the control
limits
Refer to Table S61 - Factors for Computing Control Chart Limits (3 sigma) for this problem. Ross Hopkins is attempting to monitor a filling process that has an overall average of 705 mL. The average range R is 8 ml. For a sample size of 10, the control limits for 3-sigma x chart are: Upper Control Limit (UCL.2)= ml (round your response to three decimal places). Lower Control...
 8.4 14 *9. Suppose that we are using an T-chart with subgroups of size n - 5 in an idealized setting in which the data is Normally distributed with known mean μ and standard deviation σ. We know that σ,-sd(X)-4. Use also the facts that and Assume that the process is under control and that subgroups are indepen- dent. Suppose that 100 subgroup means are plotted onto the chart over the course of a day. (a) What is the probability...
 Question 1 to 11, True or False? Applied business statistics
1) The width of the confidence interval depends only on the desired level of confidence 2) When population standard deviation is unknown, sample standaird deviation is used and the interval estimation is based on values from the t- rather than the z-distribution n 3) The z value for a 98% confidence interval around the point estimate is 2.33 4) In order to construct a 90% confidence interval for the population...
Question 1 to 11, True or False? Applied business statistics
1) The width of the confidence interval depends only on the desired level of confidence 2) When population standard deviation is unknown, sample standaird deviation is used and the interval estimation is based on values from the t- rather than the z-distribution n 3) The z value for a 98% confidence interval around the point estimate is 2.33 4) In order to construct a 90% confidence interval for the population...
 Section Two (True/False) Regarding SPC and control charts: 3. Control limits and specification limits are both provided by the customer. cause variation SPC uses graphed statics to determine if a process has special Control limits for most control charts are set at 2 standard deviations. If a control chart signals special cause variation, the cause will also be known. One should work on reducing common cause variation while eliminating special cause variation. Critical process outputs that are measured on a...
 Piston rings for an automotive engine are produced by a forging
process. We wish to monitor the inside diameter of the rings
manufactured by this process, using an x̄ and an s control chart.
Samples of size 8 are to be taken at regular intervals, and the
sample means and standard deviations are computed and plotted on
the charts in time order. The target values for the inside diameter
are a mean of μ = 75 mm and a standard...
Piston rings for an automotive engine are produced by a forging
process. We wish to monitor the inside diameter of the rings
manufactured by this process, using an x̄ and an s control chart.
Samples of size 8 are to be taken at regular intervals, and the
sample means and standard deviations are computed and plotted on
the charts in time order. The target values for the inside diameter
are a mean of μ = 75 mm and a standard...
Most questions answered within 3 hours.
-
What is facilitated diffusion and how does it differ from
symport and antiport transportation? How do...
asked 11 minutes ago -
if a firm producing 100 units at $5.00 each experience
an 80% experience curve, what will...
asked 48 minutes ago -
A solid, uniform disk of radius 0.250 m and mass 53.7 kg rolls
down a ramp...
asked 3 hours ago -
Given the following table of high speed internet access vs.
annual home income:
Home Income
%...
asked 3 hours ago -
A baseball batter hits a 0.145kg baseball straight up into the
air. The baseball leaves the...
asked 4 hours ago -
An FM modulator is tested using
single-tone baseband signal with frequency of 50kHz and a sprectrum...
asked 4 hours ago -
Write the ionic equations for the first stage of salts
hydrolysis.
Anion, Cation?
Na2S
NiSO4
K2SO4...
asked 6 hours ago -
suppose there is a normally distributed population with a mean of
250 and a standard deviation...
asked 6 hours ago -
Question Three
Suppose you as project manager are using the Waterfall
development methodology on a large...
asked 7 hours ago -
Which statement is not true about welfare in Canada?
A.Benefits typically vary based on one's ability...
asked 8 hours ago -
Please help me with FLOWCHART and UML diagram for class,
thank you!
#include <iostream>
#include <fstream>...
asked 8 hours ago -
3. Describe the “logic circuit” of the Lac operon. Which
proteins are bound or not to...
asked 9 hours ago