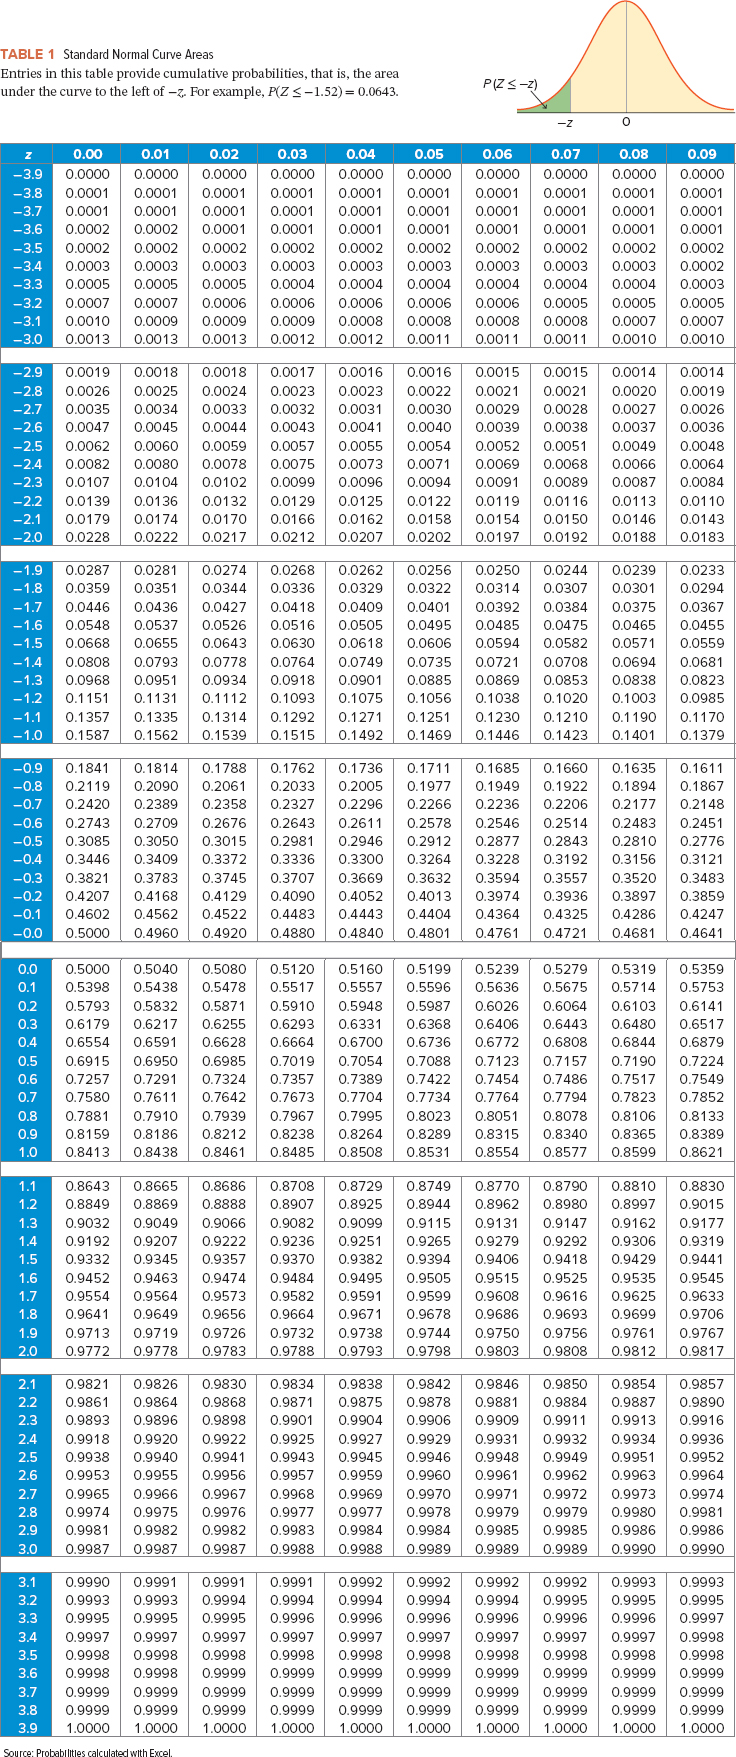
![Consider the following regression results based on 40 observations. [You may find it useful to reference the t table.] Standard Error 12.6824 0.9614 Coefficients t Stat 3.257 p-value 0.002 Intercept 1.3096 0.9535 #1 0.992 0.328 a. Specify the hypotheses to determine if the slope differs from minus one. b-1. Calculate the value of the test statistic. (Round intermediate calculations to at least 4 decimal places and final answer to 3 decimal places.) Test statistic](http://img.homeworklib.com/questions/76c32a00-c70f-11ea-9fa9-79c668797e29.png?x-oss-process=image/resize,w_560)
Homework Answers

Add Answer to:
Consider the following regression results based on 40 observations. [You may find it useful to reference...
Consider the following regression results based on 20 observations. [You may find it useful to reference...
Consider the following regression results based on 20 observations. [You may find it useful to reference the t table.] Coefficients Standard Error t Stat p-value Intercept 33.1308 4.4008 7.528 0.000 x1 0.2906 0.1944 1.495 0.152 a-1. Choose the hypotheses to determine if the intercept differs from zero. H0: β0 = 0; HA: β0 ≠ 0 H0: β0 ≥ 0; HA: β0 < 0 H0: β0 ≤ 0; HA: β0 > 0 a-2. At the 5% significance level, what is the...
When estimating a multiple linear regression model based on 30 observations, the following results were obtained....
When estimating a multiple linear regression model based on 30 observations, the following results were obtained. [You may find it useful to reference the t table.] Coefficients Standard Error t Stat p-value Intercept 151.03 128.84 1.172 0.251 x1 11.42 2.67 4.277 0.000 x2 2.00 2.02 0.990 0.330 b-1. What is the 95% confidence interval for β2? (Negative values should be indicated by a minus sign. Round "tα/2,df" value to 3 decimal places, and final answers to 2 decimal places.) c-2....
A sample of 24 observations provides the following statistics: [You may find it useful to reference...
A sample of 24 observations provides the following statistics: [You may find it useful to reference the t table.] sx = 19, sy = 16, and sxy = 118.75 a-1. Calculate the sample correlation coefficient rxy. (Round your answer to 4 decimal places.) c-1. Calculate the value of the test statistic. (Round intermediate calculations to at least 4 decimal places and final answer to 3 decimal places.)
Consider the following competing hypotheses: (You may find it useful to reference the appropriate table: z...
Consider the following competing hypotheses: (You may find it useful to reference the appropriate table: z table or t table) H0: μD ≥ 0; HA: μD < 0 d¯d¯ = −3.5, sD = 5.5, n = 21 The following results are obtained using matched samples from two normally distributed populations: a-1. Calculate the value of the test statistic, assuming that the sample difference is normally distributed. (Negative value should be indicated by a minus sign. Round intermediate calculations to at least...
Consider the following competing hypotheses: (You may find it useful to reference the appropriate table: z...
 Consider the following competing hypotheses: (You may find it useful to reference the appropriate table: z table or ttable) -4.0, SD5.8,20 The following results are obtained using matched samples from two normally distributed populations a-1. Calculate the value of the test statistic, assuming that the sample difference is normally distributed. (Negative value should be indicated by a minus sign. Round intermediate calculations to at least 4 decimal places and final answer to 2 decimal places.) Test statistic
In a simple linear regression based on 30 observations, it is found that b1 = 3.74...
In a simple linear regression based on 30 observations, it is found that b1 = 3.74 and se(b1) = 1.38. Consider the hypotheses: [You may find it useful to reference the t table.] H0: β1 = 0 and HA: β1 ≠ 0. a. Calculate the value of the test statistic. (Round your answer to 3 decimal places.)
Consider the following competing hypotheses: (You may find it useful to reference the appropriate table: z...
Consider the following competing hypotheses: (You may find it useful to reference the appropriate table: z table or t table) Hypotheses: H0: μD ≤ 2; HA: μD > 2 Sample results: d−d− = 5.6, sD = 6.2, n = 10 The following results are obtained using matched samples from two normally distributed populations: a. Calculate the value of the test statistic, assuming that the sample difference is normally distributed. (Round all intermediate calculations to at least 4 decimal places and...
Consider the following competing hypotheses and accompanying sample data. (You may find it useful to reference...
 Consider the following competing hypotheses and accompanying sample data. (You may find it useful to reference the a table: z table or ttable) He: P1 - P2 = 0.20 HA: P1 - P20.20 25 points *1 = 126 y = 243 X2 = 125 = 480 8 03.06.08 a. Calculate the value of the test statistic. (Round Intermediate calculations to at least 4 decimal places and final answer decimal places.) eBook Test statistic References b. Find the p-value. 0.01 s...
Consider the following competing hypotheses: (You may find it useful to reference the appropriate table: z...
Consider the following competing hypotheses: (You may find it useful to reference the appropriate table: z table or t table) H0: μD ≥ 0; HA: μD < 0 d¯d¯ = −3.2, sD = 6.0, n = 23 The following results are obtained using matched samples from two normally distributed populations: a-1. Calculate the value of the test statistic, assuming that the sample difference is normally distributed. (Negative value should be indicated by a minus sign. Round intermediate calculations to at least...
Consider the following competing hypotheses and accompanying sample data drawn independently from normally distributed populations. (You may find it useful to reference the appropriate table: z table or t table)
 Consider the following competing hypotheses and accompanying sample data drawn independently from normally distributed populations. (You may find it useful to reference the appropriate table: z table or t table) H0: μ1 − μ2 = 0HA: μ1 − μ2 ≠ 0 x−1x−1 = 57x−2 = 63σ1 = 11.5σ2 = 15.2n1 = 20n2 = 20a-1. Calculate the value of the test statistic. (Negative values should be indicated by a minus sign. Round all intermediate calculations to at least 4 decimal places and final answer to 2 decimal places.)Test Statistic ?
 Consider the following competing hypotheses: (You may find it useful to reference the appropriate table: z table or ttable) -4.0, SD5.8,20 The following results are obtained using matched samples from two normally distributed populations a-1. Calculate the value of the test statistic, assuming that the sample difference is normally distributed. (Negative value should be indicated by a minus sign. Round intermediate calculations to at least 4 decimal places and final answer to 2 decimal places.) Test statistic
 Consider the following competing hypotheses and accompanying sample data. (You may find it useful to reference the a table: z table or ttable) He: P1 - P2 = 0.20 HA: P1 - P20.20 25 points *1 = 126 y = 243 X2 = 125 = 480 8 03.06.08 a. Calculate the value of the test statistic. (Round Intermediate calculations to at least 4 decimal places and final answer decimal places.) eBook Test statistic References b. Find the p-value. 0.01 s...
Most questions answered within 3 hours.
-
How would you train your employees to avoid risks of using
mobile devices?
asked 16 minutes ago -
Assume Kw = 1.01 ✕ 10−14
For pure water, we can calculate [H3O+ ] = [OH...
asked 1 hour ago -
Suppose that on a temperature scale X, water boils at 203.0°X
and freezes at -105.7°X. What...
asked 2 hours ago -
BaS crystallizes in a cubic unit cell with S2- ions on each
corner and each face....
asked 2 hours ago -
A. 0≤P(Oi)≤10≤P(Oi)≤1 for each i
B. P(Oi)≤0P(Oi)≤0
C. P(Oi)=1+P(OCi)P(Oi)=1+P(OiC)
D. P(Oi)≥1P(Oi)≥1
If an experiment consists of...
asked 4 hours ago -
A battery has an emf of 9.20V and an internal resistance of 1.20
ohm. a)What resistance...
asked 4 hours ago -
The area of an elastic circular loop decreases at a constant
rate, dA/dt = −6.60×10⁻³ m2/s...
asked 5 hours ago -
The denaturation of proteins can be described by the
equilibrium
F⇌U
where F and U represent...
asked 6 hours ago -
Please answer what the maximum and minimum force is, and the
angle on the ion is...
asked 6 hours ago -
implement a program that reads a number of rows and a symbol.
The program will draw...
asked 6 hours ago -
Assume that when adults with smartphones are randomly selected,
45% use them in meetings or classes....
asked 6 hours ago -
Determine the number of formula units of
Na2SO4 and moles of oxygen contained in 8.11
moles...
asked 7 hours ago