
Homework Answers
Add Answer to:
Descriptive analysis revealed that the mean Test 3 score of all 63 students in Dr. Kilman's...
Descriptive analysis revealed that the mean Test 3 score of all 63 students in Dr. Ron’s...
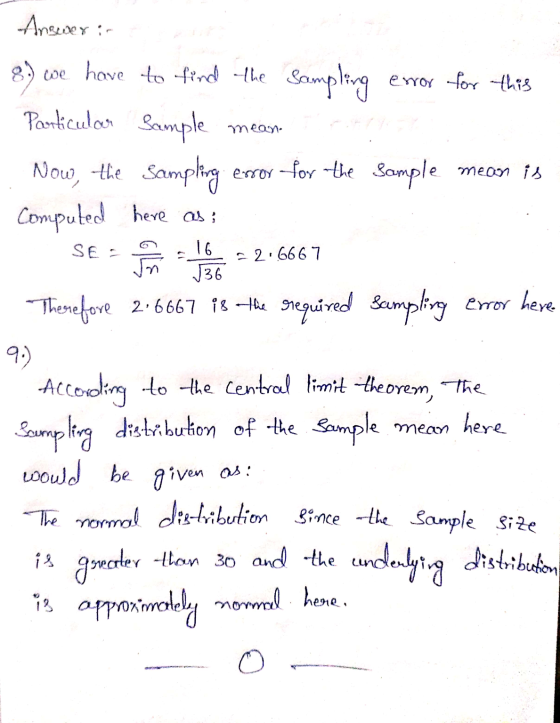
Descriptive analysis revealed that the mean Test 3 score of all 63 students in Dr. Ron’s statistics courses was an 80. Similarly, the standard deviation for all students’ Test 3 scores was found to be 16. Assume the Test 3 scores are approximately normally distributed. Descriptive analysis indicated 89% of students passed Test 3. Suppose a random sample of 50 students is drawn and defined as the proportion of students in the sample who passed Test 3. 16. According to...
Suppose scores of students on a test are approximately normally distributed with a mean score of...
Suppose scores of students on a test are approximately normally distributed with a mean score of 65 points and a standard deviation of 8 points. It is decided to give A's to 10 percent of the students. Obtain the threshold score that will result in an A.
On a nationwide test taken by high school students, the mean score was 51 and the...
On a nationwide test taken by high school students, the mean score was 51 and the standard deviation was 11 The scores were normally distributed. Complete the following statements. (a) Approximately ?% of the students scored between 40 and 62 . (b) Approximately 95% of the students scored between ? and ?
The following information corresponds to students who Took Test 4. The mean score was 59.98 points...
The following information corresponds to students who Took Test 4. The mean score was 59.98 points and the standard deviation was 13.18. Assume scores for Test 4 are normally distributed. If 10 students are randomly selected, find the probability that the mean of their test score is greater than 56.
the scores on a certain test are normally distributed with a mean score of 65 and...
the scores on a certain test are normally distributed with a mean score of 65 and a standard deviation of 2. what is the probability that a sample of 90 students will have a mean score of at least 65.2108.
An administrator at a college claims that the mean SAT Mathematics score of incoming students is...
An administrator at a college claims that the mean SAT Mathematics score of incoming students is 520. You find that in a random sample of 45 incoming students, the mean SAT Mathematics score is 511 with a standard deviation of 48.65. Assume the population of scores are normally distributed. Suppose you perform a hypothesis test to determine whether the mean SAT Mathematics score of incoming students is less than 520. What is the P-value for this hypothesis test? Round the...
The scores on a certain test are normally distributed with a mean score of 53 and...
 The scores on a certain test are normally distributed with a mean score of 53 and a standard deviation of 2. What is the probability that a sample of 90 students will have a mean score of at least 53.2108? 0.8413 0.3174 0.3413 0.1587
A principal claims the students in his school have above-average test scores for a particular standardized...
A principal claims the students in his school have above-average test scores for a particular standardized test. A sample of 50 students from his school were found to have an average test score of 77.2. The population mean for test scores for this particular test is 75, with a standard deviation of 9 (so we can assume that the population test score is normally distributed). Set up a hypothesis test to determine whether this principal’s claim is correct (use alpha...
(4)Five hundred students from a local high school took a college entrance examination. Historical data from the school record show that the standard deviation of test scores is 40. A random sampl...
 (4)Five hundred students from a local high school took a college entrance examination. Historical data from the school record show that the standard deviation of test scores is 40. A random sample of thirty- six students is taken from the entire population of 500 students. The mean test score for the sample is three hundred eighty. Find (a) 95% confidence interval for the unknown population mean test score. (b) 95% confidence interval for the unknown population mean test score if...
6. A random sample of 18 students obtained a mean score of 82 and a variance...
6. A random sample of 18 students obtained a mean score of 82 and a variance of s2=16 on a college placement test in science. Assuming the scores to be normally distributed, construct a 90 percent confidence interval for variance, σ2.
 The scores on a certain test are normally distributed with a mean score of 53 and a standard deviation of 2. What is the probability that a sample of 90 students will have a mean score of at least 53.2108? 0.8413 0.3174 0.3413 0.1587
 (4)Five hundred students from a local high school took a college entrance examination. Historical data from the school record show that the standard deviation of test scores is 40. A random sample of thirty- six students is taken from the entire population of 500 students. The mean test score for the sample is three hundred eighty. Find (a) 95% confidence interval for the unknown population mean test score. (b) 95% confidence interval for the unknown population mean test score if...
Most questions answered within 3 hours.
-
Task 5.2 Numerical Analysis Using Nested Loops (13 pts)
Consider the following program:
void setup()
{...
asked 9 minutes ago -
If a lossless transformer has 1000 turns for a primary winding
and 100 turns for the...
asked 17 minutes ago -
Write the net ionic equation for the precipitation reaction that
occurs when aqueous solutions of potassium...
asked 26 minutes ago -
it
should be written in c++
Your program should take numbers from the user until the...
asked 32 minutes ago -
Buses are powered by chemical reactions. Define matter and the
four states of matter. What is...
asked 50 minutes ago -
Use conservation of energy to find the velocity of a free point
charge q1 at 22cm...
asked 57 minutes ago -
First, describe policies promoted by governments of the
political right to address economic globalization. Second, describe...
asked 1 hour ago -
M2-9 Completing T-Accounts LO2-4
Following are the transactions of Dennen, Inc., for the month of
January....
asked 1 hour ago -
Write a program using python that reads from values from a text
file and plots them...
asked 1 hour ago -
Look up the density of
the metal of the object used in parts A and B...
asked 1 hour ago -
Discuss strategic considerations that Amazon and NYC politicians
had. Analyze why the deal between Amazon and...
asked 1 hour ago -
A combustion reaction is describes as a carbon source reacting
with oxygen and producing carbon dioxide...
asked 1 hour ago