A study was conducted to compare the proportion of drivers in Boston and New York who...
A study was conducted to compare the proportion of drivers in
Boston and New York who wore seat belts while driving. Data were
collected, and the proportion wearing seat belts in Boston was
0.581 and the proportion wearing seat belts in New York was
0.832.
Due to local laws at the time the study was conducted, it was
suspected that a smaller proportion of drivers wear seat belts in
Boston than New York.
(a) Find the test statistic for this test using Ha: pB
< pNY. (Use standard error = 0.085.)
(3 decimal places)
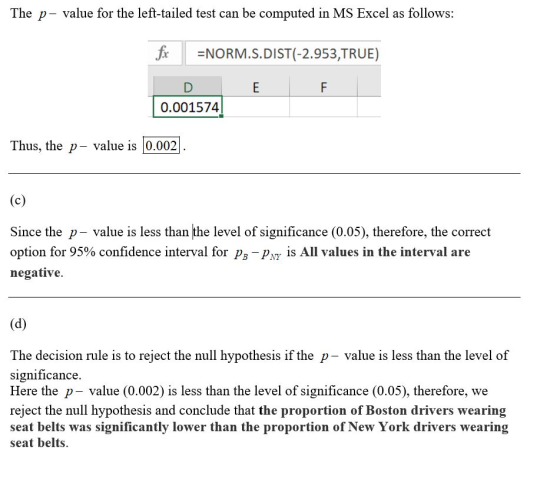
(b) Determine the p-value.
(3 decimal places)
(c) Based on this p-value, which of the following would you expect
for a 95% confidence interval for pB -
pNY?
All values in the interval are negative. Some values in the interval are positive and some are negative. All values in the interval are positive.
(d) What is the correct conclusion?
( )The proportion of Boston drivers wearing seat belts was significantly lower than the proportion of New York drivers wearing seat belts.
( )The proportion of Boston drivers wearing seat belts was significantly higher than the proportion of New York drivers wearing seat belts.
( )There was no significant difference between the proportion of drivers wearing seat belts in Boston and New York.
Homework Answers

Add Answer to:
A study was conducted to compare the proportion of drivers in
Boston and New York who...
A study was conducted to compare the proportion of drivers in Boston and New York who wore seat b...
A study was conducted to compare the proportion of drivers in Boston and New York who wore seat belts while driving. Data were collected, and the proportion wearing seat belts in Boston was 0.581 and the proportion wearing seat belts in New York was 0.832. Due to local laws at the time the study was conducted, it was suspected that a smaller proportion of drivers wear seat belts in Boston than New York. (a) Find the test statistic for this...
21.6 Seat belt use. Here are data from observing random samples of female Hispanic drivers in Bos...
 ***Please show all your work and answer the full question
21.6 Seat belt use. Here are data from observing random samples of female Hispanic drivers in Boston and New York in 2002: Divers 220 City New York Boston Belted 183 68 a) b) Is this an experiment or an observational study? Why? Do a four-step hypothesis test that a smaller proportion of female Hispanic drivers were seat belts in Boston than in New York.
21.6 Seat belt use. Here are...
***Please show all your work and answer the full question
21.6 Seat belt use. Here are data from observing random samples of female Hispanic drivers in Boston and New York in 2002: Divers 220 City New York Boston Belted 183 68 a) b) Is this an experiment or an observational study? Why? Do a four-step hypothesis test that a smaller proportion of female Hispanic drivers were seat belts in Boston than in New York.
21.6 Seat belt use. Here are...
1) A study was conducted to determine the proportion of people who dream in black and white inste...
1) A study was conducted to determine the proportion of people who dream in black and white instead of color. Among 323 people over the age of 55, 66 dream in black and white, and among 281people under the age of 25,15 dream in black and white. Use a 0.05 significance level to test the claim that the proportion of people over 55 who dream in black and white is greater than the proportion for those under 25. Complete parts...
A study was conducted in 1980 that found that New York had the slowest highway drivers...
A study was conducted in 1980 that found that New York had the slowest highway drivers in the country. The drivers traveled at an average speed of 52.7 mph. Assume the population standard deviation is 6 mph. What is the probability that a sample of 45 of the drivers will have a sample mean less than 51 mph? a) what is the standard error of the Sampling distribution? b) what is the probability that a sample of 45 of the...
A study was conducted to determine the proportion of people who dream in black and white...
A study was conducted to determine the proportion of people who dream in black and white instead of color. Among 302 people over the age of 55, 79 dream in black and white, and among 307 people under the age of 25, 17 dream in black and white. Use a 0.01 significance level to test the claim that the proportion of people over 55 who dream in black and white is greater than the proportion for those under 25. a)...
A study was conducted to determine the proportion of people who dream in black and white...
 A study was conducted to determine the proportion of people who dream in black and white instead of color. Among 324 people over the age of 55, 72 dream in black and white, and among 296 people under the age of 25, 18 dream in black and white. Use a 0.01 significance level to test the claim that the proportion of people over 55 who dream in black and white is greater than the proportion for those under 25. Complete...
tal of 475 In a study of HIV infection among women entering the New York State prison system, a to inmates were cross-c...
 tal of 475 In a study of HIV infection among women entering the New York State prison system, a to inmates were cross-classified with respect to HIV seropositivity and their histories of intra 2. use. HIV Seropositivity Negative 27 Total 339 136 Positive 312 IV Drug User es 33788175 No Total who are not IV Among women who are IV drug users, what proportion is HIV positive? Among women drug users, what proportion is HIV positive? a. 3120.42 04 2-5...
A study was conducted to determine the proportion of people who dream in black and white...
 A study was conducted to determine the proportion of people who dream in black and white instead of color. Among 318 people over the age of 55, 79 dream in black and white, and among 314 people under the age of 25, 13 dream in black and white. Use a 0.05 significance level to test the claim that the proportion of people over 55 who dream in black and white is greater than the proportion for those under 25. Complete...
For each of the following scenarios, (1) identify whether it’s observational study or experiment, and (2)...
 For each of the following scenarios, (1) identify whether it’s
observational study or experiment, and (2) identify explanatory
variable and response variable.
For each of the following scenarios, (1) identify whether it's observational study or experiment, and (2) identify explanatory variable and response variable. Studies conducted in New York City and Boston have noticed that more heart attacks occur in December and January than in all other months. Some people have tried to conclude that overindulgence causes the increased risk...
For each of the following scenarios, (1) identify whether it’s
observational study or experiment, and (2) identify explanatory
variable and response variable.
For each of the following scenarios, (1) identify whether it's observational study or experiment, and (2) identify explanatory variable and response variable. Studies conducted in New York City and Boston have noticed that more heart attacks occur in December and January than in all other months. Some people have tried to conclude that overindulgence causes the increased risk...
According to a study conducted by a statistical organization, the proportion of people who are satisfied...
 According to a study conducted by a statistical organization, the proportion of people who are satisfied with the way things are going in their lives is 0.80. Suppose that a random sample of 100 people is obtained Complete parts (a) through e) below (a) Suppose the random sample of 100 people is asked, "Are you satisfied with the way things are going in your life" is the response to this question qualitative or quantitative? Explain O A The response is...
 ***Please show all your work and answer the full question
21.6 Seat belt use. Here are data from observing random samples of female Hispanic drivers in Boston and New York in 2002: Divers 220 City New York Boston Belted 183 68 a) b) Is this an experiment or an observational study? Why? Do a four-step hypothesis test that a smaller proportion of female Hispanic drivers were seat belts in Boston than in New York.
21.6 Seat belt use. Here are...
***Please show all your work and answer the full question
21.6 Seat belt use. Here are data from observing random samples of female Hispanic drivers in Boston and New York in 2002: Divers 220 City New York Boston Belted 183 68 a) b) Is this an experiment or an observational study? Why? Do a four-step hypothesis test that a smaller proportion of female Hispanic drivers were seat belts in Boston than in New York.
21.6 Seat belt use. Here are...
 A study was conducted to determine the proportion of people who dream in black and white instead of color. Among 324 people over the age of 55, 72 dream in black and white, and among 296 people under the age of 25, 18 dream in black and white. Use a 0.01 significance level to test the claim that the proportion of people over 55 who dream in black and white is greater than the proportion for those under 25. Complete...
 tal of 475 In a study of HIV infection among women entering the New York State prison system, a to inmates were cross-classified with respect to HIV seropositivity and their histories of intra 2. use. HIV Seropositivity Negative 27 Total 339 136 Positive 312 IV Drug User es 33788175 No Total who are not IV Among women who are IV drug users, what proportion is HIV positive? Among women drug users, what proportion is HIV positive? a. 3120.42 04 2-5...
 A study was conducted to determine the proportion of people who dream in black and white instead of color. Among 318 people over the age of 55, 79 dream in black and white, and among 314 people under the age of 25, 13 dream in black and white. Use a 0.05 significance level to test the claim that the proportion of people over 55 who dream in black and white is greater than the proportion for those under 25. Complete...
 For each of the following scenarios, (1) identify whether it’s
observational study or experiment, and (2) identify explanatory
variable and response variable.
For each of the following scenarios, (1) identify whether it's observational study or experiment, and (2) identify explanatory variable and response variable. Studies conducted in New York City and Boston have noticed that more heart attacks occur in December and January than in all other months. Some people have tried to conclude that overindulgence causes the increased risk...
For each of the following scenarios, (1) identify whether it’s
observational study or experiment, and (2) identify explanatory
variable and response variable.
For each of the following scenarios, (1) identify whether it's observational study or experiment, and (2) identify explanatory variable and response variable. Studies conducted in New York City and Boston have noticed that more heart attacks occur in December and January than in all other months. Some people have tried to conclude that overindulgence causes the increased risk...
 According to a study conducted by a statistical organization, the proportion of people who are satisfied with the way things are going in their lives is 0.80. Suppose that a random sample of 100 people is obtained Complete parts (a) through e) below (a) Suppose the random sample of 100 people is asked, "Are you satisfied with the way things are going in your life" is the response to this question qualitative or quantitative? Explain O A The response is...
Most questions answered within 3 hours.
-
20% of all customers subscribe to phone service.
70% of all customers subscribe to internet service....
asked 7 minutes ago -
Write a program to solve the Josephus problem, with the following
modification:
Sample Input:
./a.out n...
asked 2 hours ago -
At the start of a CD it is spinning at a rate of 525 rpm
(revolutions...
asked 3 hours ago -
4. Without doing any calculations, predict whether the observed
∆T would increase, decrease or remain the...
asked 4 hours ago -
Based on the range, which of the following sets of scores has
the greatest variability? 3,...
asked 5 hours ago -
Ripples in a pond travel at a velocity of 3 m/s with one peak
passing a...
asked 5 hours ago -
A man stands on the roof of a building of height 13.0 mm and
throws a...
asked 5 hours ago -
The extent to which assets are financed by borrowed funds and
other liabilities is indicated by:...
asked 6 hours ago -
Explain in detail
Germany is the fifth largest economy
explain what goods and services Germany specializes...
asked 7 hours ago -
The density of platinum is 21.45 g/mL. If a cube of platinum
with a mass of...
asked 7 hours ago -
Accounts Receivable
Sales
A/R Posting
Extended Sales Invoice
Packing Slip
Compare invoice to packing slip 2...
asked 7 hours ago -
Michaella, age 23, is a full-time law student and is claimed by
her parents as a...
asked 7 hours ago