


Homework Answers

Dear student/learner, According to our protocol I am obliged to
solve only one question. you can post the second question
separately. It would be our pleasure to help you solve the second
question. I wish you best luck for your learning
endeavour.
Happy Learning
Add Answer to:
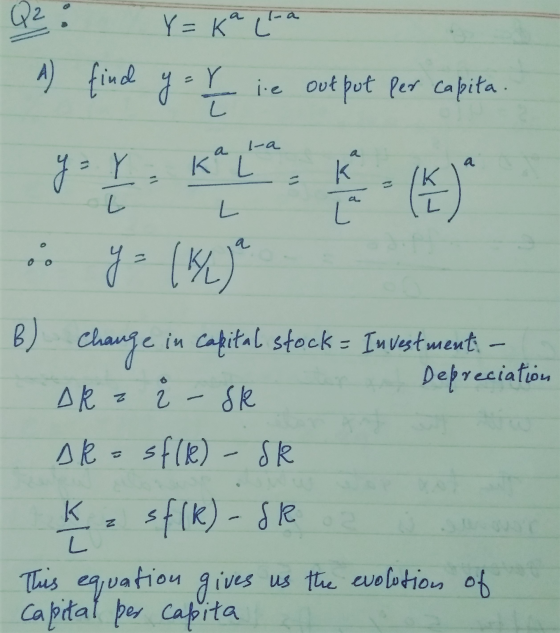
2. Consider the Solow growth model. Suppose that the production function is constant returns to scale...
4. The table below shows a Markov matrix for the income levels of 40 countries over...
 4. The table below shows a Markov matrix for the income levels of 40 countries over two centuries: Poor in 20h CE 20th CE Poor in 19th CE Middle Income in 19h CE 4 Rich in 19th CE 10 How has income inequality across these countries changed? Why?
Solow Growth Model D. Consider an economy with production characterized by function Y = AVKL, per...
 Solow Growth Model D. Consider an economy with production characterized by function Y = AVKL, per capita output y = AVkt with rate of depreciation of capital 8, investment it = sy. = sAvky, capital transition function kt+1 - k = SAVk - Okt, where s is savings ratio. 1. Putting per capita output (income) y on the y-axis and k on the x-axis, graph the curves for depre- ciation and investment. Label steady state capital k* and steady state...
Consider the Solow growth model with depreciation rate and population growth rate n. The equation of...
 Consider the Solow growth model with depreciation rate and population growth rate n. The equation of motion for the capital stock and the per worker production function in this economy are given by: Ak= s(f(k) - (8 + n) k y= f(k) = k1/4 a). Suppose adoption of modern birth control methods in a developing country causes the population growth rate to decrease. What happens in the main Solow diagram: what curve(s) shin, what happens to the steady- state level...
MALTHUS AND SOLOW GROWTH MODEL
Malthusian Model of Growth Notation: Yt Aggregate output; Nt Population size; L¯ Land (fixed); ct Per capita consumption Production: Aggregate production function is Yt = F(Nt , Lt) = zN2/3 t L 1/3 t Population Dynamics: Nt+1 = g(ct)Nt Population growth function: g(ct) = (3ct) 1/3 Parameter Values: Land: L¯ = 1000 for all t. Productivity parameter: z = 1 ...
Exercise 1: Solow model . Consider an economy whose production function is defined by Y (t)...
Exercise 1: Solow model . Consider an economy whose production function is defined by Y (t) = F (K (t), L (t)) = K (t) 1 − α · L (t) α. with 0 <α <1. In this economy, the population grows at the following rate: L (t) = n + β where n and β are strictly positive constants and k (t) represents capital per capita: k (t) = L (t). Moreover, a constant part of the product is...
Suppose an economy follows the Solow growth model, with constant investment, depreciation, and population growth rates....
Suppose an economy follows the Solow growth model, with constant investment, depreciation, and population growth rates. Please explain your answers. (a) Suppose that the government withdraws an investment tax credit leading to a permanent drop in the investment rate. Discuss the effect on the level and growth of per capita income (PCI) in the short run. What happens to the level and growth of PCI in the long-run? (b) Suppose that the economy is below its steady state level per...
Consider a country described by the Solow model. The production function is y = 29, where...
 Consider a country described by the Solow model. The production function is y = 29, where 0 <a < 1. Assume that capital depreciates at a rate 8 € (0,1). a) Write down this production function in levels instead of in per capita terms. Does it display constant returns to scale? Show it. What about if a = 1? b) Find the value of c (per capita consumption) in steady state. c) Find the level of per capita capital that...
1. Consider the simple version of the Solow Growth Model discussed in class summarized by these...
 1. Consider the simple version of the Solow Growth Model discussed in class summarized by these four equations: Consumers save a fraction s of output: 1 = sy Capital grows as follows: K' = 1 + (1 - 8)K Firms use capital to make output: Y = AK 0.3 There is no government or trade: Y = C+/ where Y is GDP, / is investment, C is consumption, s is the savings rate, K is the capital stock this year,...
3. Transition Dynamics Consider the Solow growth model with constant population and no techno- logical progress...
 3. Transition Dynamics Consider the Solow growth model with constant population and no techno- logical progress as studied in class. Suppose the economy is initially in the steady state, with the level of per-capita capital stock of kss. The per-capita production function is given by y -f (k) - Akt, 0 < α < 1. In each of the following scenarios, plot the transition time path of per capita capital stock. kt, per-capita output, yt, and per-capita consumption, ct- (1-s...
Growth rates in the Solow model
Growth rates in the Solow model (II): Suppose an economy begins in steady state and is characterized by the following parameter values: s 0.2, d 0.1, A 1, L 100. Apply your answer to question 8 to calculate the growth of per capita GDP in the period immediately after each of the changes listed below. (Hint: Since the economy begins in steady state, its growth rate is initially zero and Kt K*.)(a) The investment rate doubles.(b) The productivity level rises...
 4. The table below shows a Markov matrix for the income levels of 40 countries over two centuries: Poor in 20h CE 20th CE Poor in 19th CE Middle Income in 19h CE 4 Rich in 19th CE 10 How has income inequality across these countries changed? Why?
 Solow Growth Model D. Consider an economy with production characterized by function Y = AVKL, per capita output y = AVkt with rate of depreciation of capital 8, investment it = sy. = sAvky, capital transition function kt+1 - k = SAVk - Okt, where s is savings ratio. 1. Putting per capita output (income) y on the y-axis and k on the x-axis, graph the curves for depre- ciation and investment. Label steady state capital k* and steady state...
 Consider the Solow growth model with depreciation rate and population growth rate n. The equation of motion for the capital stock and the per worker production function in this economy are given by: Ak= s(f(k) - (8 + n) k y= f(k) = k1/4 a). Suppose adoption of modern birth control methods in a developing country causes the population growth rate to decrease. What happens in the main Solow diagram: what curve(s) shin, what happens to the steady- state level...
 Consider a country described by the Solow model. The production function is y = 29, where 0 <a < 1. Assume that capital depreciates at a rate 8 € (0,1). a) Write down this production function in levels instead of in per capita terms. Does it display constant returns to scale? Show it. What about if a = 1? b) Find the value of c (per capita consumption) in steady state. c) Find the level of per capita capital that...
 1. Consider the simple version of the Solow Growth Model discussed in class summarized by these four equations: Consumers save a fraction s of output: 1 = sy Capital grows as follows: K' = 1 + (1 - 8)K Firms use capital to make output: Y = AK 0.3 There is no government or trade: Y = C+/ where Y is GDP, / is investment, C is consumption, s is the savings rate, K is the capital stock this year,...
 3. Transition Dynamics Consider the Solow growth model with constant population and no techno- logical progress as studied in class. Suppose the economy is initially in the steady state, with the level of per-capita capital stock of kss. The per-capita production function is given by y -f (k) - Akt, 0 < α < 1. In each of the following scenarios, plot the transition time path of per capita capital stock. kt, per-capita output, yt, and per-capita consumption, ct- (1-s...
Most questions answered within 3 hours.
-
Can I get some samples of the following:
1) Write four sentences in first person, singular....
asked 2 minutes ago -
Described how search engines work. Be sure to describe in detail
.
asked 2 minutes ago -
The position of a particle as a function of time is given by
x=(2.0m/s)t+(−3.0m/s3)t^3. Part A...
asked 8 minutes ago -
If you wanted to insert a gene into a plasmid, why
would it be helpful to...
asked 7 minutes ago -
Provide your solved Excel Model Spreadsheet + Answer Report +
Sensitivity Report.
There are 1,400/2,500/1,200/700 applicants...
asked 7 minutes ago -
There are 32 chocolates in a box, all identically shaped. There are
12 filled with nuts,...
asked 20 minutes ago -
There are n candies on the table. Alice and Bob independently
pick k random candies each....
asked 19 minutes ago -
Complete the following probability table. (Round Prior
Probability and Posterior Probability answers to 2 decimal places...
asked 16 minutes ago -
In carrying out the first standardization in an experiment, a
student used 0.5449g of potassium hydrogen...
asked 16 minutes ago -
Consider the following information:
State Probability Stock A Stock B Stock C
Boom 0.65 0.26 0.17...
asked 19 minutes ago -
The equilibrium constant, Kp, for the following reaction
is 0.110 at 298 K:
NH4HS(s)
->NH3(g) +...
asked 24 minutes ago -
This program should be in c++.
Rock Paper Scissors: This game is played by children and...
asked 23 minutes ago