
Homework Answers
Add Answer to:
(1 point) Independent random samples, each containing 80 observations, were selected from two populations. The samples...
(1 point) Independent random samples, each containing 800 observations, were selected from two binomial populations. The...
 (1 point) Independent random samples, each containing 800 observations, were selected from two binomial populations. The samples from populations 1 and 2 produced 581 and 221 successes, respectively. (a) Test Ho : (p1 – P2) = 0 against Ha : (Pi – P2) # 0. Use a = 0.01 test statistic = rejection region |z| > The final conclusion is # 0. A. We can reject the null hypothesis that (p1 – P2) = 0 and accept that (p1 –...
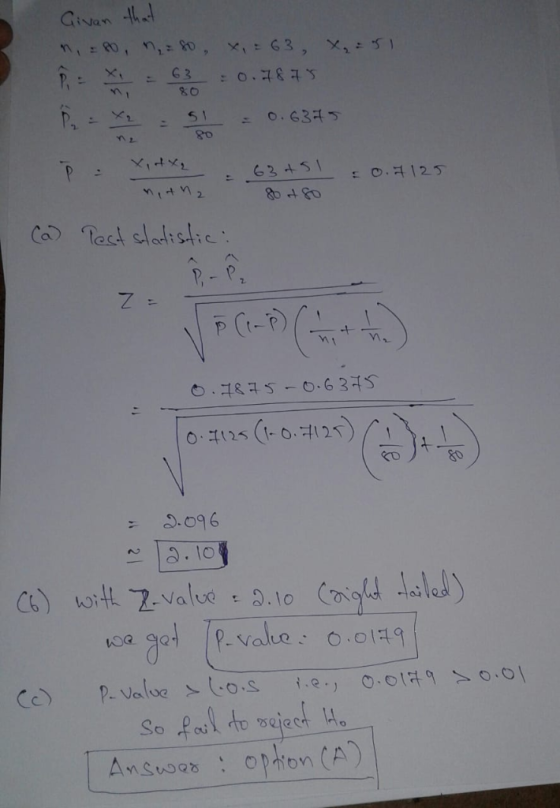
Independent random samples, each containing 90 observations, were selected from two populations. The samples from populations...
Independent random samples, each containing 90 observations, were selected from two populations. The samples from populations 1 and 2 produced 50 and 42 successes, respectively. Test H0:(p1−p2)=0 against Ha:(p1−p2)≠0. Use α=0.04. (a) The test statistic is (b) The P-value is (c) The final conclusion is A. We can reject the null hypothesis that (p1−p2)=0 and accept that (p1−p2)≠0. B. There is not sufficient evidence to reject the null hypothesis that (p1−p2)=0. side note- no idea how to find a test...
1 point) Independent random samples, each containing 50 observations, were selected from two populations. The samples...
1 point) Independent random samples, each containing 50 observations, were selected from two populations. The samples from populations 1 and 2 produced 34 and 27 successes, respectively. Test H0:(p1−p2)=0H0:(p1−p2)=0 against Ha:(p1−p2)≠0Ha:(p1−p2)≠0. Use α=0.1α=0.1. (a) The test statistic is (b) The P-value is (c) The final conclusion is A. We can reject the null hypothesis that (p1−p2)=0(p1−p2)=0 and accept that (p1−p2)≠0(p1−p2)≠0. B. There is not sufficient evidence to reject the null hypothesis that (p1−p2)=0(p1−p2)=0.
(1 point) Independent random samples, each containing 90 observations, were selected from two populations. The samples...
(1 point) Independent random samples, each containing 90 observations, were selected from two populations. The samples from populations 1 and 2 produced 37 and 30 successes, respectively. Test H 0 :( p 1 − p 2 )=0 H0:(p1−p2)=0 against H a :( p 1 − p 2 )≠0 Ha:(p1−p2)≠0 . Use α=0.05 α=0.05 . (a) The test statistic is (b) The P-value is (c) The final conclusion is A. We can reject the null hypothesis that ( p 1 −...
Independent random samples of n = 150 and n = 150 observations were randomly selected from...
 Independent random samples of n = 150 and n = 150 observations were randomly selected from binomial populations 1 and 2, respectively. Sample 1 had 68 successes, and sample 2 had 74 successes. You wish to perform a hypothesis test to determine if there is a difference in the sample proportions P, and py: (a) State the null and alternative hypotheses. O Ho: (P1 - P2) = 0 versus Ha: (P1-P2) < 0 O Ho: (2,-) < versus H: (2,-2)...
(1 point) In order to compare the means of two populations, independent random samples of 271...
 (1 point) In order to compare the means of two populations, independent random samples of 271 observations are selected from each population, with the following results: Sample 1 Sample 2 1145 2 120 (a) Use a 99 % confidence interval to estimate the difference between the population means (A-μ). (b) Test the null hypothesis: HO : (μί-12-0 versus the alternative hypothesis. Ha : (μ-μ2)メ (i) the test statistic z () the positive critical z score (ii) the negative critical z...
In order to compare the means of two populations, independent random samples of 220 observations are...
In order to compare the means of two populations, independent random samples of 220 observations are selected from each population, with the following results: Sample 1 Sample 2 ?⎯⎯⎯1=0 ?⎯⎯⎯2=5 ?1=165 ?2=200 (a) Use a 97 % confidence interval to estimate the difference between the population means (?1−?2). ≤(?1−?2)≤ (b) Test the null hypothesis: ?0:(?1−?2)=0 versus the alternative hypothesis: ??:(?1−?2)≠0. Using ?=0.03, give the following: the test statistic ?= The final conclusion is: A. There is not sufficient evidence to...
Independent random samples of size n1=38 and n2=86 observations, were selected from two populations. The samples...
Independent random samples of size n1=38 and n2=86 observations, were selected from two populations. The samples from populations 1 and 2 produced x1=18 and x2=13 successes, respectively. Define p1 and p2 to be the proportion of successes in populations 1 and 2, respectively. We would like to test the following hypotheses: H0:p1=p2 versus H1:p1≠p2 (a)To test H0 versus H1, which inference procedure should you use? A. Two-sample z procedure B. One-sample z procedure C. One-sample t procedure D. Two-sample t...
come from populations (1 point) Test t mean. Assume that the samples are independent simple random samples. Use a significance level of a 0.01 Sample 1: n1 15, 1-28.4, 81-6.07 Sample 2: n2 10, 2 22,...
 come from populations (1 point) Test t mean. Assume that the samples are independent simple random samples. Use a significance level of a 0.01 Sample 1: n1 15, 1-28.4, 81-6.07 Sample 2: n2 10, 2 22, 82 8.92 (a) The degree of freedom is (b) The standardized test statistic is (c) The final conclusion is O A. We can reject the null hypothesis that (14-Ha) 0 and accept that (M1-μ2) 0 B. There is not sufficient evidence to reject the...
Independent random samples were selected from two binomial populations, with sample sizes and the number of...
 Independent random samples were selected from two binomial populations, with sample sizes and the number of successes given below. Population 1 2 500 500 119 148 Sample Size Number of Successes State the null and alternative hypotheses to test for a difference in the two population proportions. O Ho: (P1-P2) # O versus H: (P1-P2) = 0 O Ho: (P1-P2) = 0 versus Hy: (P1-P2) > 0 HO: (P1-P2) < 0 versus Ha: (P1-P2) > 0 HO: (P1-P2) = 0...
 (1 point) Independent random samples, each containing 800 observations, were selected from two binomial populations. The samples from populations 1 and 2 produced 581 and 221 successes, respectively. (a) Test Ho : (p1 – P2) = 0 against Ha : (Pi – P2) # 0. Use a = 0.01 test statistic = rejection region |z| > The final conclusion is # 0. A. We can reject the null hypothesis that (p1 – P2) = 0 and accept that (p1 –...
 Independent random samples of n = 150 and n = 150 observations were randomly selected from binomial populations 1 and 2, respectively. Sample 1 had 68 successes, and sample 2 had 74 successes. You wish to perform a hypothesis test to determine if there is a difference in the sample proportions P, and py: (a) State the null and alternative hypotheses. O Ho: (P1 - P2) = 0 versus Ha: (P1-P2) < 0 O Ho: (2,-) < versus H: (2,-2)...
 (1 point) In order to compare the means of two populations, independent random samples of 271 observations are selected from each population, with the following results: Sample 1 Sample 2 1145 2 120 (a) Use a 99 % confidence interval to estimate the difference between the population means (A-μ). (b) Test the null hypothesis: HO : (μί-12-0 versus the alternative hypothesis. Ha : (μ-μ2)メ (i) the test statistic z () the positive critical z score (ii) the negative critical z...
 come from populations (1 point) Test t mean. Assume that the samples are independent simple random samples. Use a significance level of a 0.01 Sample 1: n1 15, 1-28.4, 81-6.07 Sample 2: n2 10, 2 22, 82 8.92 (a) The degree of freedom is (b) The standardized test statistic is (c) The final conclusion is O A. We can reject the null hypothesis that (14-Ha) 0 and accept that (M1-μ2) 0 B. There is not sufficient evidence to reject the...
 Independent random samples were selected from two binomial populations, with sample sizes and the number of successes given below. Population 1 2 500 500 119 148 Sample Size Number of Successes State the null and alternative hypotheses to test for a difference in the two population proportions. O Ho: (P1-P2) # O versus H: (P1-P2) = 0 O Ho: (P1-P2) = 0 versus Hy: (P1-P2) > 0 HO: (P1-P2) < 0 versus Ha: (P1-P2) > 0 HO: (P1-P2) = 0...
Most questions answered within 3 hours.
-
(63
#14)
which of the following statments best describes how chamging
the concentration of the substances...
asked 1 hour ago -
In the following reaction, which element is undergoing
oxidation: Na2SO3 + N2O --> N2 + Na2SO4...
asked 2 hours ago -
Which of the following pairs of ions have the same electron
configuration?
I: Br− and Se2−...
asked 4 hours ago -
The Foremost Composite Materials Company is planning a two-day
sales conference for October 19-20. The conference...
asked 5 hours ago -
3) Illustrate the observed pattern of relatedness of organisms
versus adaptations to specific conditions. This means...
asked 5 hours ago -
In winter a lake has a 0.35 m thick ice layer over 1.10 m of
water....
asked 6 hours ago -
Assuming the following has been encrypted with a Vigenere cipher
below, use the method(s) and assumptions...
asked 6 hours ago -
How would I use switch statements to write a program that will
take an input of...
asked 6 hours ago -
Imagine a reaction in which methane gas combusts at a constant
pressure of 1 atm and...
asked 6 hours ago -
Two parallel wires (each 12 m in length) are separated by a
distance of 0.065 m...
asked 6 hours ago -
Suppose there were three masses at the corner of uniform
equilateral triangle. The masses are m1...
asked 6 hours ago -
Situation: A building that is 618 m above the ground floor. How
many times would a...
asked 6 hours ago