
Homework Answers

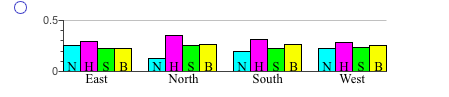
dividing each value by row total
| Oi | not HS | HS | some coll | Bachelor or high |
| east | 0.253 | 0.292 | 0.229 | 0.227 |
| north | 0.129 | 0.355 | 0.251 | 0.266 |
| south | 0.193 | 0.314 | 0.225 | 0.268 |
| west | 0.230 | 0.283 | 0.234 | 0.254 |
Add Answer to:
B Question Heip Not a H.S. H.S. An economist wants to determine whether the region a...
0 The following data represent the level Education of health and the level of education for...
 0 The following data represent the level Education of health and the level of education for Not a H.S. graduate a random sample of 1687 residents H.S. graduate Complete parts (a) and (b) below. Some college Bachelor Degree or higher Excellent 74 92 63 75 Good 134 121 148 137 Fair 109 95 80 105 Poor 118 93 126 117 (a) Does the sample evidence suggest that level of education and health are independent at the a=0.05 level of significance?...
please. i checked the first part but am not sure if am right. please help me.answer...
 please. i checked the first part but am not sure if am right.
please help me.answer all the question
Apoll investigated the respondents' party a (Assume a significance level of 0.05) cons based on what region they lived in Tost an appropriate hypothesis about this table, and to the proper conclusions North South First, determine the appropriate and formative Ivypotheses. Choose the correct answer below OA Ho: Pocal party is independent of region HA Pornical party is not independent of...
please. i checked the first part but am not sure if am right.
please help me.answer all the question
Apoll investigated the respondents' party a (Assume a significance level of 0.05) cons based on what region they lived in Tost an appropriate hypothesis about this table, and to the proper conclusions North South First, determine the appropriate and formative Ivypotheses. Choose the correct answer below OA Ho: Pocal party is independent of region HA Pornical party is not independent of...
Mask?/Region Yes No Total East 243 73 316 West 237 76 313 North 249 54 303...
 Mask?/Region Yes No Total East 243 73 316 West 237 76 313 North 249 54 303 South 230 94 324 Total 959 297 1256 The contingency table shows a random sample of people in a country divided up by region and whether they would wear a mask during a virus pandemic. At a 1% Level of significance, test to determine whether willingness to wear a mask depends on the region in which people live. 1. The hypotheses are : Ho:Region...
b Statisti 1 pl Help region, and (d) decide whether you should reject or fail to...
 b Statisti 1 pl Help region, and (d) decide whether you should reject or fail to reject the null hypothesis. The samples are random and independent Claim μι < μ2, α:001. Sample statistics: x,-1220, n1-45, x2-1200, and n2 85 Population statistics: σ 1 80 and σ2-100 (a) The test statistic for μ1-y2 is (b) The standardized test statistic for μ1-μ2 is-]. (Round to two decimal places as needed) (c) Is the standardized test statistic in the rejection region? O Yes...
A bottled water distributor wants to determine whether the mean amount of water contained in 1-gallon...
 A bottled water distributor wants to determine whether the mean amount of water contained in 1-gallon bottles purchased from a nationally known water bottling company is actually 1 gallon. You know from the water bottling company specifications that the standard deviation of the amount of water is 0.011 gallon. You select a random sample of 45 bottles, and the mean amount of water per 1-gallon bottle is 0.995 gallon. Complete parts (a) through (e) below. a. Is there evidence that...
A bottled water distributor wants to determine whether the mean amount of water contained in 1-gallon bottles purchased from a nationally known water bottling company is actually 1 gallon. You know f...
 A bottled water distributor wants to determine whether the mean amount of water contained in 1-gallon bottles purchased from a nationally known water bottling company is actually 1 gallon. You know from the water bottling company specifications that the standard deviation of the amount of water is 0.02 gallon. You select a random sample of 45 bottles, and the mean amount of water per 1-gallon bottle is 0.994 gallon. Complete parts (a) through (d) below. a. Is there evidence that...
Historically, the proportions of all Caucasians in the United States with blood phenotypes A, B, AB, and O are 0.41, 0.10, 0.04, and 0.45, respectively. To determine whether current population pr...
 Historically, the proportions of all Caucasians in the United States with blood phenotypes A, B, AB, and O are 0.41, 0.10, 0.04, and 0.45, respectively. To determine whether current population proportions still match these historical values, a random sample of 200 American Caucasians were selected, and their blood phenotypes were recorded. The observed numbers with each phenotype are given in the following table. 8817 13 2 (a) Is there sufficient evidence, at the 0.05 level of significance, to claim that...
A bottled water distributor wants to determine whether the mean amount of water contained in 1-gallon...
 A bottled water distributor wants to determine whether the mean amount of water contained in 1-gallon bottles purchased from a nationally known water botting company is actually 1 gallon. You know from the water bottling company specifications that the standard deviation of the amount of water is 0.03 gallon. You select a random sample of 50 bottles, and the mean amount of water per 1-gallon bottle is 0.997 gallon. Complete parts (a) through (d) below. What is the final conclusion?...
9.2 question 5 part b only explain how you find the confidence interval as well please!!...
 9.2
question 5
part b only
explain how you find the confidence interval as well
please!!
Homework: 9.2-9.3 homework Save Score: 0.5 of 1 pt 5 of 15 (15 complete) HW Score: 57.81%, 8.67 of 15 pts 9.2.7-T Question Help Proctored Nonproctored A study was done on proctored and nonproctored tests. The results are shown in the table. Assume that the two samples are independent simple 11 H2 random samples selected from normally distributed populations, and do not assume that...
9.2
question 5
part b only
explain how you find the confidence interval as well
please!!
Homework: 9.2-9.3 homework Save Score: 0.5 of 1 pt 5 of 15 (15 complete) HW Score: 57.81%, 8.67 of 15 pts 9.2.7-T Question Help Proctored Nonproctored A study was done on proctored and nonproctored tests. The results are shown in the table. Assume that the two samples are independent simple 11 H2 random samples selected from normally distributed populations, and do not assume that...
Question Help A study was conducted to determine whether magnets were effective in treating pain. The...
 Question Help A study was conducted to determine whether magnets were effective in treating pain. The values the visual analog scale. Assume that both samples are s n 1.26 20 0.42 t m ees Sham ple random samples from populations having normal distributions. Use a 0.05 0.92 0.49 Magnet 20 significance level to test the claim that those given a sham treatment have pain reductions that vary more than the pain reductions for those treated with magnets. What are the...
 0 The following data represent the level Education of health and the level of education for Not a H.S. graduate a random sample of 1687 residents H.S. graduate Complete parts (a) and (b) below. Some college Bachelor Degree or higher Excellent 74 92 63 75 Good 134 121 148 137 Fair 109 95 80 105 Poor 118 93 126 117 (a) Does the sample evidence suggest that level of education and health are independent at the a=0.05 level of significance?...
 please. i checked the first part but am not sure if am right.
please help me.answer all the question
Apoll investigated the respondents' party a (Assume a significance level of 0.05) cons based on what region they lived in Tost an appropriate hypothesis about this table, and to the proper conclusions North South First, determine the appropriate and formative Ivypotheses. Choose the correct answer below OA Ho: Pocal party is independent of region HA Pornical party is not independent of...
please. i checked the first part but am not sure if am right.
please help me.answer all the question
Apoll investigated the respondents' party a (Assume a significance level of 0.05) cons based on what region they lived in Tost an appropriate hypothesis about this table, and to the proper conclusions North South First, determine the appropriate and formative Ivypotheses. Choose the correct answer below OA Ho: Pocal party is independent of region HA Pornical party is not independent of...
 Mask?/Region Yes No Total East 243 73 316 West 237 76 313 North 249 54 303 South 230 94 324 Total 959 297 1256 The contingency table shows a random sample of people in a country divided up by region and whether they would wear a mask during a virus pandemic. At a 1% Level of significance, test to determine whether willingness to wear a mask depends on the region in which people live. 1. The hypotheses are : Ho:Region...
 b Statisti 1 pl Help region, and (d) decide whether you should reject or fail to reject the null hypothesis. The samples are random and independent Claim μι < μ2, α:001. Sample statistics: x,-1220, n1-45, x2-1200, and n2 85 Population statistics: σ 1 80 and σ2-100 (a) The test statistic for μ1-y2 is (b) The standardized test statistic for μ1-μ2 is-]. (Round to two decimal places as needed) (c) Is the standardized test statistic in the rejection region? O Yes...
 A bottled water distributor wants to determine whether the mean amount of water contained in 1-gallon bottles purchased from a nationally known water bottling company is actually 1 gallon. You know from the water bottling company specifications that the standard deviation of the amount of water is 0.011 gallon. You select a random sample of 45 bottles, and the mean amount of water per 1-gallon bottle is 0.995 gallon. Complete parts (a) through (e) below. a. Is there evidence that...
 A bottled water distributor wants to determine whether the mean amount of water contained in 1-gallon bottles purchased from a nationally known water bottling company is actually 1 gallon. You know from the water bottling company specifications that the standard deviation of the amount of water is 0.02 gallon. You select a random sample of 45 bottles, and the mean amount of water per 1-gallon bottle is 0.994 gallon. Complete parts (a) through (d) below. a. Is there evidence that...
 Historically, the proportions of all Caucasians in the United States with blood phenotypes A, B, AB, and O are 0.41, 0.10, 0.04, and 0.45, respectively. To determine whether current population proportions still match these historical values, a random sample of 200 American Caucasians were selected, and their blood phenotypes were recorded. The observed numbers with each phenotype are given in the following table. 8817 13 2 (a) Is there sufficient evidence, at the 0.05 level of significance, to claim that...
 A bottled water distributor wants to determine whether the mean amount of water contained in 1-gallon bottles purchased from a nationally known water botting company is actually 1 gallon. You know from the water bottling company specifications that the standard deviation of the amount of water is 0.03 gallon. You select a random sample of 50 bottles, and the mean amount of water per 1-gallon bottle is 0.997 gallon. Complete parts (a) through (d) below. What is the final conclusion?...
 9.2
question 5
part b only
explain how you find the confidence interval as well
please!!
Homework: 9.2-9.3 homework Save Score: 0.5 of 1 pt 5 of 15 (15 complete) HW Score: 57.81%, 8.67 of 15 pts 9.2.7-T Question Help Proctored Nonproctored A study was done on proctored and nonproctored tests. The results are shown in the table. Assume that the two samples are independent simple 11 H2 random samples selected from normally distributed populations, and do not assume that...
9.2
question 5
part b only
explain how you find the confidence interval as well
please!!
Homework: 9.2-9.3 homework Save Score: 0.5 of 1 pt 5 of 15 (15 complete) HW Score: 57.81%, 8.67 of 15 pts 9.2.7-T Question Help Proctored Nonproctored A study was done on proctored and nonproctored tests. The results are shown in the table. Assume that the two samples are independent simple 11 H2 random samples selected from normally distributed populations, and do not assume that...
 Question Help A study was conducted to determine whether magnets were effective in treating pain. The values the visual analog scale. Assume that both samples are s n 1.26 20 0.42 t m ees Sham ple random samples from populations having normal distributions. Use a 0.05 0.92 0.49 Magnet 20 significance level to test the claim that those given a sham treatment have pain reductions that vary more than the pain reductions for those treated with magnets. What are the...
Most questions answered within 3 hours.
-
A construction company is planning to bid on a building
contract. The bid costs the company...
asked 10 minutes ago -
A sample of 45 observations is selected from a normal
population. The sample mean is 49,...
asked 12 minutes ago -
A firm operating in a purely competitive environment is faced
with a market price of $250....
asked 17 minutes ago -
•Let’s say someone claims the average population size is
600 feet squared and the housing authority...
asked 24 minutes ago -
Cynaide is a deadly poison that blocks the last step in the
electron transport chain of...
asked 28 minutes ago -
Your friend tells you that there is a vending machine on campus
that dispenses M&M packs...
asked 44 minutes ago -
What advantages are there to using piperidine rather than
hydroxide as a base?
asked 42 minutes ago -
7. The life of a Freeze Breeze electric fan is normally
distributed with a mean 4...
asked 45 minutes ago -
1. A 751 mL NaCl solution is diluted to a volume of 1.06 L and a...
asked 50 minutes ago -
8
A $20,000 face value STRIPS is currently quoted at 38.642 and
has 8 years to...
asked 50 minutes ago -
The current exchange rate between the Japanese yen and
the US dollar is 120 yen per...
asked 52 minutes ago -
Marla’s Massages and More bought a special massage table two
years ago for $9,300. At the...
asked 59 minutes ago