Just need the answer to question 6 using the information provided in the block above question 5. Please be clear due to this being a multi-step problem. Thanks
Homework Answers

Add Answer to:
Just need the answer to question 6 using the information
provided in the block above question...
(1 point) Definition: The AREA A of the region that lies under the graph of the...
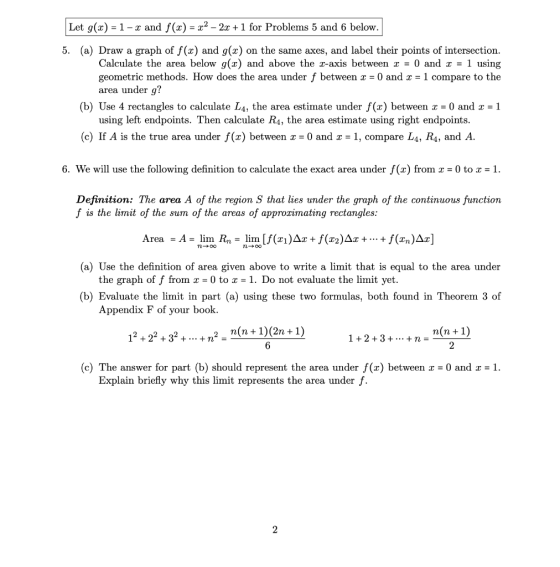
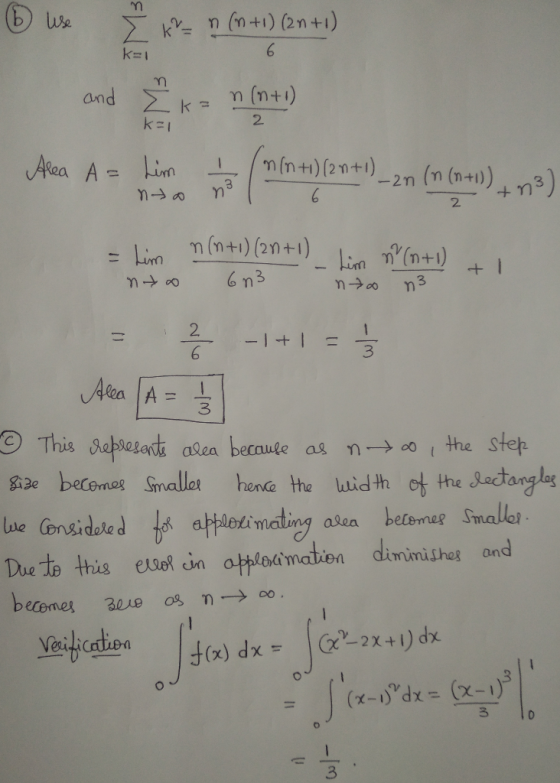
 (1 point) Definition: The AREA A of the region that lies under the graph of the continuous function f is the limit of the sum of the areas of approximating rectangles A = lim R, = lim [f(x)Ar + f(x2)Ax+... +f(x,y)Ax] 100 Wspacelin (a) Use the above definition to determine which of the following expressions represents the area under the graph of f(x) = x3 from x = 0 to x = 2. 64 A. lim 7100 11 i= B....
(1 pt) Use rectangles to find the estimate of each type for the area under the given graph off fr...
 (1 pt) Use rectangles to find the estimate of each type for the area under the given graph off from x = 0 to x = 8. 1.0 1. Use four rectangles and take the sample points from the left-endpoints. Answer: L4 = 2. Use four rectangles and take the sample points from the right-endpoints. swer: R4 = 3. Use eight rectangles and take the sample points from the left-endpoints. We were unable to transcribe this image
(1 pt) Use...
(1 pt) Use rectangles to find the estimate of each type for the area under the given graph off from x = 0 to x = 8. 1.0 1. Use four rectangles and take the sample points from the left-endpoints. Answer: L4 = 2. Use four rectangles and take the sample points from the right-endpoints. swer: R4 = 3. Use eight rectangles and take the sample points from the left-endpoints. We were unable to transcribe this image
(1 pt) Use...
send help for these 4 questions, please show steps Definition: The AREA A of the region...
 send help for these 4 questions, please show steps
Definition: The AREA A of the region S that lies under the graph of the continuous function f is the limit of the sum of the areas of approximating rectangles A = lim R, = lim [f(x)Ax +f(x2)Ax+...+f(x)Ax] - 00 Consider the function f(x) = x, 13x < 16. Using the above definition, determine which of the following expressions represents the area under the graph off as a limit. A. lim...
send help for these 4 questions, please show steps
Definition: The AREA A of the region S that lies under the graph of the continuous function f is the limit of the sum of the areas of approximating rectangles A = lim R, = lim [f(x)Ax +f(x2)Ax+...+f(x)Ax] - 00 Consider the function f(x) = x, 13x < 16. Using the above definition, determine which of the following expressions represents the area under the graph off as a limit. A. lim...
6. ESTIMATE the area under f(x)=x2-12x+46 on [2,14] using n= 4 rectangles and Left-Hand endpoints. SHOW...
 6. ESTIMATE the area under f(x)=x2-12x+46 on [2,14] using n= 4 rectangles and Left-Hand endpoints. SHOW ALL WORK 15pts a) Find Ar b) List all x's c) Construct a proper summation for your estimate and then evaluate it.
(a) Estimate the area under the graph of f(x) = 2/x from x = 1 to...
 (a) Estimate the area under the graph of f(x) = 2/x from x = 1 to x = 5 using four approximating rectangles and right endpoints. | R = (b) Repeat part (a) using left endpoints. L = (c) By looking at a sketch of the graph and the rectangles, determine for each estimate whether is overestimates, underestimates, or is the exact area. ? 1. R4 42. L
Evaluate the Riemann sum for f() = 1.2 – 2² over the interval (0, 2) using...
 Evaluate the Riemann sum for f() = 1.2 – 2² over the interval (0, 2) using four subintervals, taking the sample points to be left endpoints. L4 Report answers accurate to 3 places. Remember not to round too early in your calculations. Screen Shot 2020-07-23 at 8.57.43 AM Search over the interval (3, 8) using five approximating Estimate the area under the graph of f(x) rectangles and right endpoints. R. Repeat the approximation using left endpoints. L. Report answers accurate...
Approximate the area under the graph of f(x) and above the x-axis using n rectangles f(x)...
 Approximate the area under the graph of f(x) and above the x-axis using n rectangles f(x) = 2x + 3 from x = 0 to x = 2; n = 4; use right endpoints 17 O 15 13 11
PLEASE SHOW WORK WITH CLEAR STEPS 11. f (x) 5- x2 Estimate the area under the graph from x1 to x 2 using three rectangles and right endpoints. Then improve your estimate by using six rectangles. Sketc...
 PLEASE SHOW WORK WITH CLEAR
STEPS
11. f (x) 5- x2 Estimate the area under the graph from x1 to x 2 using three rectangles and right endpoints. Then improve your estimate by using six rectangles. Sketch the curve and the approximating rectangles. ее
11. f (x) 5- x2 Estimate the area under the graph from x1 to x 2 using three rectangles and right endpoints. Then improve your estimate by using six rectangles. Sketch the curve and the approximating...
PLEASE SHOW WORK WITH CLEAR
STEPS
11. f (x) 5- x2 Estimate the area under the graph from x1 to x 2 using three rectangles and right endpoints. Then improve your estimate by using six rectangles. Sketch the curve and the approximating rectangles. ее
11. f (x) 5- x2 Estimate the area under the graph from x1 to x 2 using three rectangles and right endpoints. Then improve your estimate by using six rectangles. Sketch the curve and the approximating...
Week 1: Problem 21 Previous Problem List Next (1 point) Definition: The AREA A of the...
 Week 1: Problem 21 Previous Problem List Next (1 point) Definition: The AREA A of the region that lies under the graph of the continuous function is the limit of the sum of the areas of approximating rectangles A - lim R. - lim (/(x1)Ar + ()Ar+...+(2.)A: () = 352 10. Using the above definition determine which of the following expressions represents the area under the Consider the function graph off as a limit. A. lim j7 ln() lo in...
Peer Leading Exercise 7 Spring 2019: Area Under the Given a function (x), the area under the curve is the area of the region bordered by the x -sxis and the graph of y(x). Area under the curv...
 Peer Leading Exercise 7 Spring 2019: Area Under the Given a function (x), the area under the curve is the area of the region bordered by the x -sxis and the graph of y(x). Area under the curve is somehow related to anti-derivatives. We wish to Example: Let f(x) -10-2x. Find the area under the curve between x 0 and x graph to help you visualize what is going on. Do you recognize the shape? 5. We include a 2...
 (1 point) Definition: The AREA A of the region that lies under the graph of the continuous function f is the limit of the sum of the areas of approximating rectangles A = lim R, = lim [f(x)Ar + f(x2)Ax+... +f(x,y)Ax] 100 Wspacelin (a) Use the above definition to determine which of the following expressions represents the area under the graph of f(x) = x3 from x = 0 to x = 2. 64 A. lim 7100 11 i= B....
 (1 pt) Use rectangles to find the estimate of each type for the area under the given graph off from x = 0 to x = 8. 1.0 1. Use four rectangles and take the sample points from the left-endpoints. Answer: L4 = 2. Use four rectangles and take the sample points from the right-endpoints. swer: R4 = 3. Use eight rectangles and take the sample points from the left-endpoints. We were unable to transcribe this image
(1 pt) Use...
(1 pt) Use rectangles to find the estimate of each type for the area under the given graph off from x = 0 to x = 8. 1.0 1. Use four rectangles and take the sample points from the left-endpoints. Answer: L4 = 2. Use four rectangles and take the sample points from the right-endpoints. swer: R4 = 3. Use eight rectangles and take the sample points from the left-endpoints. We were unable to transcribe this image
(1 pt) Use...
 send help for these 4 questions, please show steps
Definition: The AREA A of the region S that lies under the graph of the continuous function f is the limit of the sum of the areas of approximating rectangles A = lim R, = lim [f(x)Ax +f(x2)Ax+...+f(x)Ax] - 00 Consider the function f(x) = x, 13x < 16. Using the above definition, determine which of the following expressions represents the area under the graph off as a limit. A. lim...
send help for these 4 questions, please show steps
Definition: The AREA A of the region S that lies under the graph of the continuous function f is the limit of the sum of the areas of approximating rectangles A = lim R, = lim [f(x)Ax +f(x2)Ax+...+f(x)Ax] - 00 Consider the function f(x) = x, 13x < 16. Using the above definition, determine which of the following expressions represents the area under the graph off as a limit. A. lim...
 6. ESTIMATE the area under f(x)=x2-12x+46 on [2,14] using n= 4 rectangles and Left-Hand endpoints. SHOW ALL WORK 15pts a) Find Ar b) List all x's c) Construct a proper summation for your estimate and then evaluate it.
 (a) Estimate the area under the graph of f(x) = 2/x from x = 1 to x = 5 using four approximating rectangles and right endpoints. | R = (b) Repeat part (a) using left endpoints. L = (c) By looking at a sketch of the graph and the rectangles, determine for each estimate whether is overestimates, underestimates, or is the exact area. ? 1. R4 42. L
 Evaluate the Riemann sum for f() = 1.2 – 2² over the interval (0, 2) using four subintervals, taking the sample points to be left endpoints. L4 Report answers accurate to 3 places. Remember not to round too early in your calculations. Screen Shot 2020-07-23 at 8.57.43 AM Search over the interval (3, 8) using five approximating Estimate the area under the graph of f(x) rectangles and right endpoints. R. Repeat the approximation using left endpoints. L. Report answers accurate...
 Approximate the area under the graph of f(x) and above the x-axis using n rectangles f(x) = 2x + 3 from x = 0 to x = 2; n = 4; use right endpoints 17 O 15 13 11
 PLEASE SHOW WORK WITH CLEAR
STEPS
11. f (x) 5- x2 Estimate the area under the graph from x1 to x 2 using three rectangles and right endpoints. Then improve your estimate by using six rectangles. Sketch the curve and the approximating rectangles. ее
11. f (x) 5- x2 Estimate the area under the graph from x1 to x 2 using three rectangles and right endpoints. Then improve your estimate by using six rectangles. Sketch the curve and the approximating...
PLEASE SHOW WORK WITH CLEAR
STEPS
11. f (x) 5- x2 Estimate the area under the graph from x1 to x 2 using three rectangles and right endpoints. Then improve your estimate by using six rectangles. Sketch the curve and the approximating rectangles. ее
11. f (x) 5- x2 Estimate the area under the graph from x1 to x 2 using three rectangles and right endpoints. Then improve your estimate by using six rectangles. Sketch the curve and the approximating...
 Week 1: Problem 21 Previous Problem List Next (1 point) Definition: The AREA A of the region that lies under the graph of the continuous function is the limit of the sum of the areas of approximating rectangles A - lim R. - lim (/(x1)Ar + ()Ar+...+(2.)A: () = 352 10. Using the above definition determine which of the following expressions represents the area under the Consider the function graph off as a limit. A. lim j7 ln() lo in...
 Peer Leading Exercise 7 Spring 2019: Area Under the Given a function (x), the area under the curve is the area of the region bordered by the x -sxis and the graph of y(x). Area under the curve is somehow related to anti-derivatives. We wish to Example: Let f(x) -10-2x. Find the area under the curve between x 0 and x graph to help you visualize what is going on. Do you recognize the shape? 5. We include a 2...
Most questions answered within 3 hours.
-
An MNE is this kind of industry when competition in one country
is essentially independent of...
asked 22 minutes ago -
. For this set of questions, determine what
proportion of a normal distribution is located betweeneach...
asked 57 minutes ago -
A college student is employed as a door-to-door newspaper
salesman. Historical data suggests that the student...
asked 1 hour ago -
MATLAB HW 11 problem using Switch Case and Input commands
Write a script file that calculates...
asked 1 hour ago -
Considering gravitational time dilation, calculate the time that
passes in Earth’s surface while 1 hour passes...
asked 2 hours ago -
Minitab Problem: Take the Lake Hume June rainfall data and find
use the processes outlined in...
asked 3 hours ago -
X Company is trying to decide whether to continue using old
equipment to make Product A...
asked 3 hours ago -
IN PYTHON ONLY !! Program 2: Re-work
program #5 (WeeklyHours) from the previous assignment such that...
asked 3 hours ago -
The average length of time between arrivals at a turnpike
toll-booth is 26 seconds. What is...
asked 5 hours ago -
(a) A piston at 6.1 atm contains a gas that occupies a volume of
3.5 L....
asked 6 hours ago -
Please answer true or false. Words
cannot be changed or added in to make it true...
asked 6 hours ago -
An empty test tube weighs 15.923 grams. Then,
MgCl2•6H2O is added into the test tube. After...
asked 6 hours ago