FIND THE P VALUE
Consider the following hypotheses:
H0: p ≥ 0.50
HA: p < 0.50
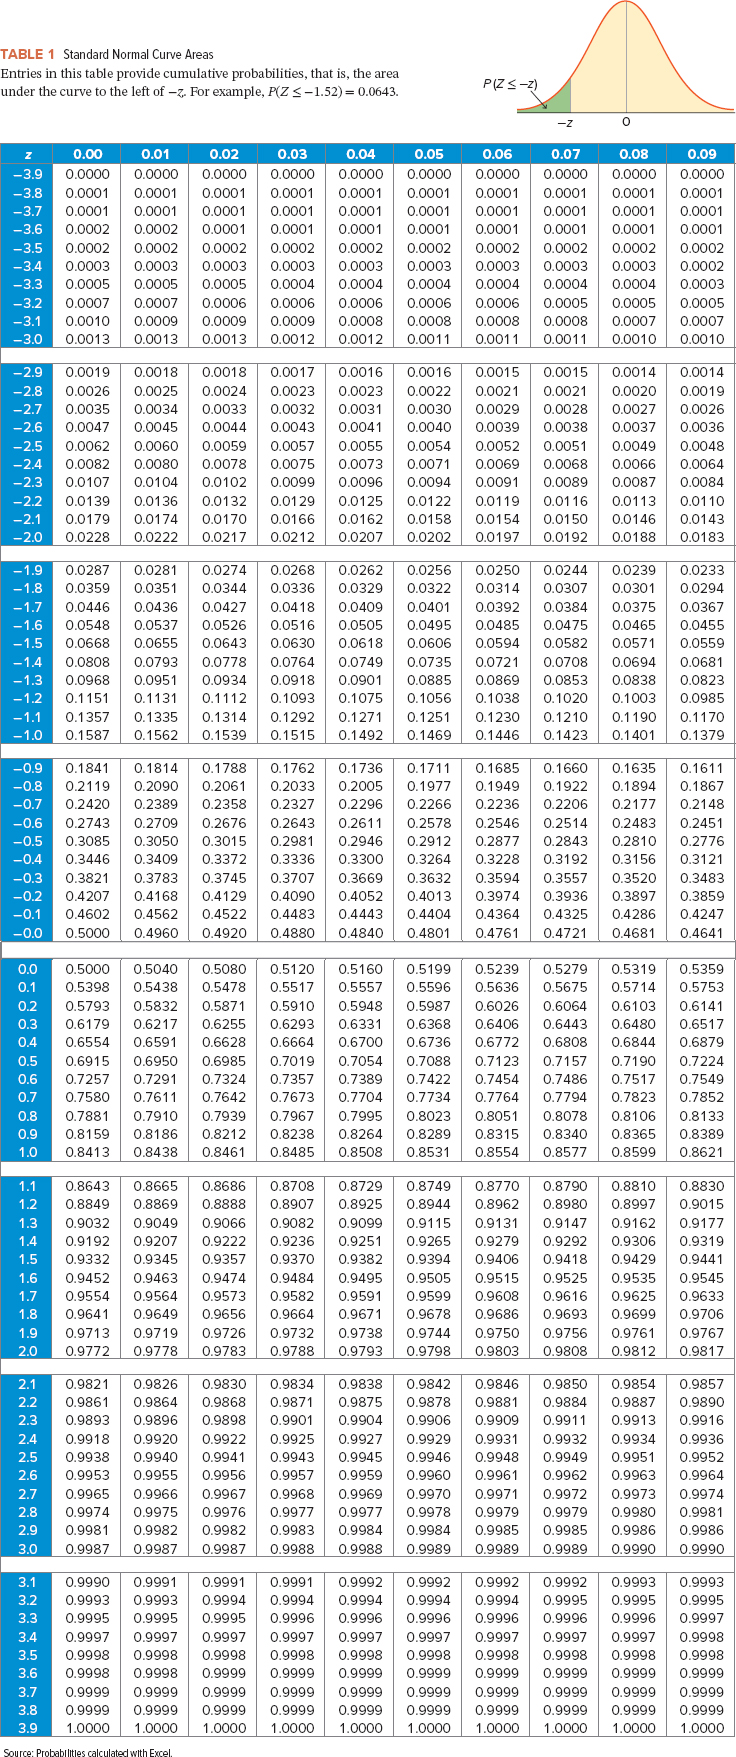
Compute the p-value based on the following sample information. (You may find it useful to reference the appropriate table: z table ort table) (Round "z" value to 2 decimal places. Round intermediate calculations to at least 4 decimal places and final answers to 4 decimal places.)
| a. | x = 40; n = 87 | |||
| b. | x = 108; n = 269 |
Homework Answers


![2: 0:47-0.50 0.50 (1-0.50) 53 -0.03 v0.0047 -0.03 0.0686 : F0.4373] 1 -10.44 - P(Z <-0.44)= 10.3300 -d) Given that P 2047 and](http://img.homeworklib.com/questions/c2092af0-d487-11ea-a078-71244c76dd73.png?x-oss-process=image/resize,w_560)
Consider the following hypotheses: Ho: p2 0.3!5 HA: p<0.35 Compute the p-value based on the following...
 Consider the following hypotheses: Ho: p2 0.3!5 HA: p<0.35 Compute the p-value based on the following sample information. (You may find it useful to reference the appropriate table: z table or ttable) (Round "z" valueto 2 decimal places. Round intermediate calculations to at least 4 decimal places and final answers to 4 decimal places.) p-value a. x- 30; n130 b.x-85; n-327 С. р- 0.33; n 64 d. p-0.33; n 448
Consider the following hypotheses: Ho: p2 0.48 HAP<0.48 Compute the p-value based on the following sample...
 Consider the following hypotheses: Ho: p2 0.48 HAP<0.48 Compute the p-value based on the following sample information. (You may find it useful to reference the appropriate table: z table or t table) (Round "z" value to 2 decimal places. Round intermediate calculations to at least 4 decimal places and final answers to 4 decimal places.) p-value a. X = 47; n - 127 b. x - 124; n - 327 c. P = 0.41; n = 54 d. 0.41; n...
Consider the following competing hypotheses: (You may find it useful to reference the appropriate table: z...
Consider the following competing hypotheses: (You may find it useful to reference the appropriate table: z table or t table) Hypotheses: H0: μD ≤ 2; HA: μD > 2 Sample results: d−d− = 5.6, sD = 6.2, n = 10 The following results are obtained using matched samples from two normally distributed populations: a. Calculate the value of the test statistic, assuming that the sample difference is normally distributed. (Round all intermediate calculations to at least 4 decimal places and...
Consider the following hypotheses: He: p2 0.44 HAP<0.44 Compute the p-value based on the following sample...
 Consider the following hypotheses: He: p2 0.44 HAP<0.44 Compute the p-value based on the following sample information. (You may find it useful to reference the appropriate table: z table or 1 table) (Round "z" value to 2 decimal places. Round intermediate calculations to at least 4 decimal places and final answers to 4 decimal places.) p-value a. X = 31; n = 86 b. x = 114; n = 326 c. P = 0.34; n = 65 d. P =...
Consider the following competing hypotheses: (You may find it useful to reference the appropriate table: z...
Consider the following competing hypotheses: (You may find it useful to reference the appropriate table: z table or t table) H0: μD ≥ 0; HA: μD < 0 d¯d¯ = −3.5, sD = 5.5, n = 21 The following results are obtained using matched samples from two normally distributed populations: a-1. Calculate the value of the test statistic, assuming that the sample difference is normally distributed. (Negative value should be indicated by a minus sign. Round intermediate calculations to at least...
In order to conduct a hypothesis test for the population proportion, you sample 400 observations that...
In order to conduct a hypothesis test for the population proportion, you sample 400 observations that result in 212 successes. (You may find it useful to reference the appropriate table: z table or t table) H0: p ≥ 0.54; HA: p < 0.54. a-1. Calculate the value of the test statistic. (Negative value should be indicated by a minus sign. Round intermediate calculations to at least 4 decimal places and final answer to 2 decimal places.) H0: p = 0.54;...
Consider the following hypotheses H0 : μ- 5,900 HA: μ 5,900 The population is normally distributed...
 Consider the following hypotheses H0 : μ- 5,900 HA: μ 5,900 The population is normally distributed with a population standard deviation of 620. Compute the value of the test statistic and the resulting p-value for each of the following sample results. For each sample, determine if you can "reject/do not reject" the null hypothesis at the 10% significance level. (You may find it useful to reference the appropriate table z table or table ( legative values should be indicated by...
Consider the following competing hypotheses and accompanying sample data drawn independently from normally distributed populations. (You may find it useful to reference the appropriate table: z table or t table)
 Consider the following competing hypotheses and accompanying sample data drawn independently from normally distributed populations. (You may find it useful to reference the appropriate table: z table or t table) H0: μ1 − μ2 = 0HA: μ1 − μ2 ≠ 0 x−1x−1 = 57x−2 = 63σ1 = 11.5σ2 = 15.2n1 = 20n2 = 20a-1. Calculate the value of the test statistic. (Negative values should be indicated by a minus sign. Round all intermediate calculations to at least 4 decimal places and final answer to 2 decimal places.)Test Statistic ?
Consider the following hypotheses: H0: μ = 9,100 HA: μ ≠ 9,100 The population is normally...
Consider the following hypotheses: H0: μ = 9,100 HA: μ ≠ 9,100 The population is normally distributed with a population standard deviation of 700. Compute the value of the test statistic and the resulting p-value for each of the following sample results. For each sample, determine if you can "reject/do not reject" the null hypothesis at the 10% significance level. (You may find it useful to reference the appropriate table: z table or t table) (Negative values should be indicated...
Consider the following hypotheses: Ho: p 20.38 HA: P 0.38 Which of the following sample information...
 Consider the following hypotheses: Ho: p 20.38 HA: P 0.38 Which of the following sample information enables us to reject the null hypothesis at a 0.01 and at a 0.10? (You may find it useful to reference the appropriate table: z table or ttable) (Round all intermediate calculations to at least 4 decimal places.) a 0.01 a 0.10 a. x b.x 110; n-300 (Click to select (Click to select) (Click to select) 22; n-74 (Click to select)Ckto seect) Click to...
 Consider the following hypotheses: Ho: p2 0.3!5 HA: p<0.35 Compute the p-value based on the following sample information. (You may find it useful to reference the appropriate table: z table or ttable) (Round "z" valueto 2 decimal places. Round intermediate calculations to at least 4 decimal places and final answers to 4 decimal places.) p-value a. x- 30; n130 b.x-85; n-327 С. р- 0.33; n 64 d. p-0.33; n 448
 Consider the following hypotheses: Ho: p2 0.48 HAP<0.48 Compute the p-value based on the following sample information. (You may find it useful to reference the appropriate table: z table or t table) (Round "z" value to 2 decimal places. Round intermediate calculations to at least 4 decimal places and final answers to 4 decimal places.) p-value a. X = 47; n - 127 b. x - 124; n - 327 c. P = 0.41; n = 54 d. 0.41; n...
 Consider the following hypotheses: He: p2 0.44 HAP<0.44 Compute the p-value based on the following sample information. (You may find it useful to reference the appropriate table: z table or 1 table) (Round "z" value to 2 decimal places. Round intermediate calculations to at least 4 decimal places and final answers to 4 decimal places.) p-value a. X = 31; n = 86 b. x = 114; n = 326 c. P = 0.34; n = 65 d. P =...
 Consider the following hypotheses H0 : μ- 5,900 HA: μ 5,900 The population is normally distributed with a population standard deviation of 620. Compute the value of the test statistic and the resulting p-value for each of the following sample results. For each sample, determine if you can "reject/do not reject" the null hypothesis at the 10% significance level. (You may find it useful to reference the appropriate table z table or table ( legative values should be indicated by...
 Consider the following hypotheses: Ho: p 20.38 HA: P 0.38 Which of the following sample information enables us to reject the null hypothesis at a 0.01 and at a 0.10? (You may find it useful to reference the appropriate table: z table or ttable) (Round all intermediate calculations to at least 4 decimal places.) a 0.01 a 0.10 a. x b.x 110; n-300 (Click to select (Click to select) (Click to select) 22; n-74 (Click to select)Ckto seect) Click to...
Most questions answered within 3 hours.
-
Consider the competitive environment of Starbuck's, Progressive
Insurance, a manufacturing firm with low turnover, or a...
asked 31 minutes ago -
3. Gains from trade
Consider two neighbouring island countries called Euphoria and
Contente. They each have...
asked 2 hours ago -
A business executive has the option to invest money in two
plans: Plan A guarantees that...
asked 4 hours ago -
Hello, can someone please help me answer this question?
How much heat is absorbed by a...
asked 4 hours ago -
. A marketing researcher conducted a survey of 25 shoppers
randomly selected at the local mall...
asked 5 hours ago -
Create an comprehensive response to the
following:
Antimicrobial agents work on a multitude of microbes (bacteria,...
asked 5 hours ago -
6.13 LAB: Step counter. Section 6.3.
A pedometer treats walking 2,000 steps as walking 1 mile....
asked 4 hours ago -
(14.2) A block of mass m = 10 kg riding on a frictionless
horizontal plane is...
asked 5 hours ago -
Use any search engine to search for articles about Starbucks
partnership with Tata Companies in India...
asked 4 hours ago -
Let’s say that for some reason Bank Excess Reserves suddenly
increase sharply. What effect would this...
asked 5 hours ago -
Given:
Curent Assets: $600,000
Total Assets: $2,600,000
Current Liabilities: $500,000
Total Liabilities: $1,700,000
What is the...
asked 5 hours ago -
1. What is a “Bankster”? What is insider trading? Why is it
illegal?
2. What is...
asked 5 hours ago