Q. Multiply rect[n] by ramp[n] in matlab and show that result is odd function in your...
Q. Multiply rect[n] by ramp[n] in matlab and show that result is odd function in your plot?
Homework Answers
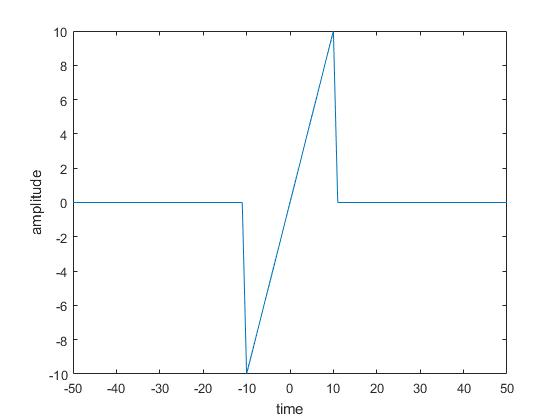
n=-50:1:50;
rect=1.*(abs(n)<=10);
ramp=n;
f=rect.*ramp;
plot(n,f);
ylabel('amplitude');
xlabel('time')
This is an Odd signal
Add Answer to:
Q. Multiply rect[n] by ramp[n] in matlab and show that result is
odd function in your...
write a matlab script for a generic ramp function r(t) then plot for y=ramp(t,3,0). The variable...
write a matlab script for a generic ramp function r(t) then plot for y=ramp(t,3,0). The variable t is in the interval-5<t<5 and increments in steps of 0.01 function y = ramp(t,m,ad). %t= time support, m= ramp slope, ad = signal advance(positive)/delay(negative)
Create a function in MATLAB “rampseq”, which performs following operations: Function [x,n]=rampseq(n0,n1,n2) • Takes three parameters...
Create a function in MATLAB “rampseq”, which performs following operations: Function [x,n]=rampseq(n0,n1,n2) • Takes three parameters (n0, n1, n2) as input, where ‘n1’ and ‘n2’ are lower and upper limits of naxis, and ‘n0’ is the delay. • Generates a ramp sequence using above mentioned three parameters. • There should be two output arguments [x, n] of function ‘rampseq’, where ‘x’ is impulse sequence and ‘n’ is its corresponding n-axis. • Finally, plot ramp impulse ‘x’ against vector ‘n’.
I. The autocorrelation function of a random signal is R(r) !-ⓞrect rect a. Find the power...
 I. The autocorrelation function of a random signal is R(r) !-ⓞrect rect a. Find the power spectral density of the signal. b. Plot the amplitude of the power spectral density with Matlab (Let Ts -2) c. Find the null-to-null bandpass bandwidth, and the 0-to-null baseband bandwidth (in terms of Ts).
3) Develop a Matlab function to compute the velocity v of a particular projectile as a...
 3) Develop a Matlab function to compute the velocity v of a particular projectile as a function of time t. In this problem, the velocity profile is described by a piecewise function, and is parameterized by 11 parameters, a, b, c, d, g, h, k, m, n, p, and q, as at - bt, 05158 c-dt, 851516 v(t;a,b,c,d,g,h,k,m,n, p,q) = gt +h(t – k)?, 1651526 me=n(t-p), > 26 else. Your Matlab function must take as input the current time value...
Q#2 (22 points) (a) Find the Fourier series of the function by expanding the function as...
 Q#2 (22 points) (a) Find the Fourier series of the function by expanding the function as an odd periodic function with a period of 10 units, as shown in Figure below. Plot the first, second, third and fourth partial sums of this Fourier series between -5 to +5 (Matlab is preferable). There will be single graph with 4 plots (b) Draw the amplitude versus frequency spectrum for first four non-zero terms of the Fourier series. Note that y(t) for -5<t<...
General Guidelines MATLAB Symbolic Computations are NOT allowed for this assignment. Generate ALL plots using MATLAB....
 General Guidelines MATLAB Symbolic Computations are NOT allowed for this assignment. Generate ALL plots using MATLAB. Include your MATLAB codes as an appendix at the end of your document. All plots should be clearly labeled: provide a X-axes and y-axes labels, specify units as needed, add titles and legend as needed, add grids as needed, use different line stiles and/or symbols as needed. 6) Consider the CT signal X(t) = u(t)- r(t) +r(t-1), where r(t) = t.u(t). a) Derive the...
Provide Matlab Code. with graph. Q.4 Plot the following function f(t)- Plot f(2t-3).
 Provide Matlab Code. with graph.
Q.4 Plot the following function f(t)- Plot f(2t-3).
Provide Matlab Code. with graph.
Q.4 Plot the following function f(t)- Plot f(2t-3).
Write a Matlab script for a 2-dimentional Cellular automata. Plot your result.
Write a Matlab script for a 2-dimentional Cellular automata. Plot your result.
Write the functions to add, subtract, multiply and divide two doubles. The function returns the result...
Write the functions to add, subtract, multiply and divide two doubles. The function returns the result on the operation. Write a program to test your functions. In visual studios console application C#.
Solve these nonlinear equations with fsolve function in Matlab. Verify your result with ezplot function. f(x7,x)=...
 Solve these nonlinear equations with fsolve function in Matlab. Verify your result with ezplot function. f(x7,x)= x; - 4x} - x,x2 fz(x, , x)= 2x, – x3 – 3x,X,
 I. The autocorrelation function of a random signal is R(r) !-ⓞrect rect a. Find the power spectral density of the signal. b. Plot the amplitude of the power spectral density with Matlab (Let Ts -2) c. Find the null-to-null bandpass bandwidth, and the 0-to-null baseband bandwidth (in terms of Ts).
 3) Develop a Matlab function to compute the velocity v of a particular projectile as a function of time t. In this problem, the velocity profile is described by a piecewise function, and is parameterized by 11 parameters, a, b, c, d, g, h, k, m, n, p, and q, as at - bt, 05158 c-dt, 851516 v(t;a,b,c,d,g,h,k,m,n, p,q) = gt +h(t – k)?, 1651526 me=n(t-p), > 26 else. Your Matlab function must take as input the current time value...
 Q#2 (22 points) (a) Find the Fourier series of the function by expanding the function as an odd periodic function with a period of 10 units, as shown in Figure below. Plot the first, second, third and fourth partial sums of this Fourier series between -5 to +5 (Matlab is preferable). There will be single graph with 4 plots (b) Draw the amplitude versus frequency spectrum for first four non-zero terms of the Fourier series. Note that y(t) for -5<t<...
 General Guidelines MATLAB Symbolic Computations are NOT allowed for this assignment. Generate ALL plots using MATLAB. Include your MATLAB codes as an appendix at the end of your document. All plots should be clearly labeled: provide a X-axes and y-axes labels, specify units as needed, add titles and legend as needed, add grids as needed, use different line stiles and/or symbols as needed. 6) Consider the CT signal X(t) = u(t)- r(t) +r(t-1), where r(t) = t.u(t). a) Derive the...
 Provide Matlab Code. with graph.
Q.4 Plot the following function f(t)- Plot f(2t-3).
Provide Matlab Code. with graph.
Q.4 Plot the following function f(t)- Plot f(2t-3).
 Solve these nonlinear equations with fsolve function in Matlab. Verify your result with ezplot function. f(x7,x)= x; - 4x} - x,x2 fz(x, , x)= 2x, – x3 – 3x,X,
Most questions answered within 3 hours.
-
An MNE is this kind of industry when competition in one country
is essentially independent of...
asked 13 minutes ago -
. For this set of questions, determine what
proportion of a normal distribution is located betweeneach...
asked 48 minutes ago -
A college student is employed as a door-to-door newspaper
salesman. Historical data suggests that the student...
asked 1 hour ago -
MATLAB HW 11 problem using Switch Case and Input commands
Write a script file that calculates...
asked 1 hour ago -
Considering gravitational time dilation, calculate the time that
passes in Earth’s surface while 1 hour passes...
asked 2 hours ago -
Minitab Problem: Take the Lake Hume June rainfall data and find
use the processes outlined in...
asked 2 hours ago -
X Company is trying to decide whether to continue using old
equipment to make Product A...
asked 3 hours ago -
IN PYTHON ONLY !! Program 2: Re-work
program #5 (WeeklyHours) from the previous assignment such that...
asked 3 hours ago -
The average length of time between arrivals at a turnpike
toll-booth is 26 seconds. What is...
asked 5 hours ago -
(a) A piston at 6.1 atm contains a gas that occupies a volume of
3.5 L....
asked 6 hours ago -
Please answer true or false. Words
cannot be changed or added in to make it true...
asked 6 hours ago -
An empty test tube weighs 15.923 grams. Then,
MgCl2•6H2O is added into the test tube. After...
asked 6 hours ago