
Homework Answers

Add Answer to:
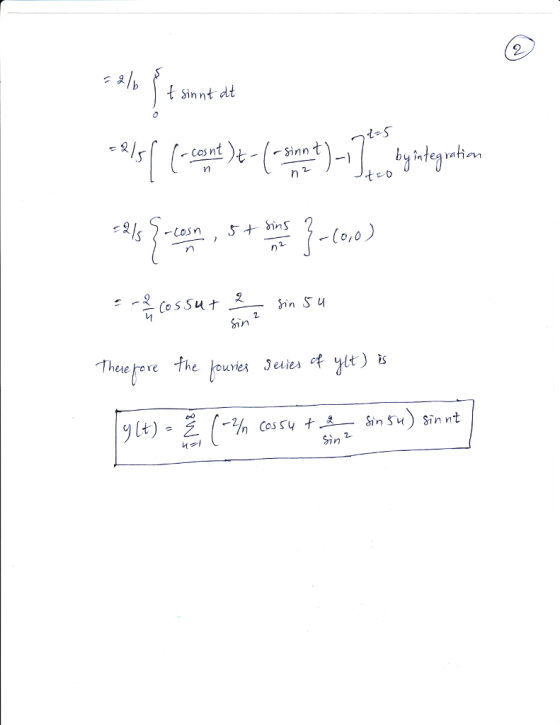
Q#2 (22 points) (a) Find the Fourier series of the function by expanding the function as...
11.1 and 11.2 Fourier Series Q1 Find the Fourier series of the given function f(x), which is assu...
 11.1 and 11.2 Fourier Series Q1 Find the Fourier series of the given function f(x), which is assumed to have the period 2π. Show the details of your work. Sketch or graph the partial sums up to that including cos 5x and sin 5x. Note: Plot the partial sum using MATLAB. Hint: Make use of your knowledge of the line equation to find f(x) from the given graph. -π 0
11.1 and 11.2 Fourier Series Q1 Find the Fourier series...
11.1 and 11.2 Fourier Series Q1 Find the Fourier series of the given function f(x), which is assumed to have the period 2π. Show the details of your work. Sketch or graph the partial sums up to that including cos 5x and sin 5x. Note: Plot the partial sum using MATLAB. Hint: Make use of your knowledge of the line equation to find f(x) from the given graph. -π 0
11.1 and 11.2 Fourier Series Q1 Find the Fourier series...
Problem 2: A periodic signalxit) is shown below A =10, T-4 sec. -T Write a MATLAB script to plot ...
 Problem 2: A periodic signalxit) is shown below A =10, T-4 sec. -T Write a MATLAB script to plot the signal, using enough points to get a smooth curve. Compute the Fourier series coefficients for the signal (if you can find them in the text, that is ok). Plot the single-sided or double-sided spectra for each signal. Include enough frequencies in the plots to adequately represent the frequency content of the signals. Plot partial sums of the Fourier series for...
A periodic signal, x(t) is shown below. A = 10, T-4 sec. -T Write a MATLAB script to plot the sig...
 A periodic signal, x(t) is shown below. A = 10, T-4 sec. -T Write a MATLAB script to plot the signal, using enough points to get a smooth curve. Compute the Fourier series coefficients for the signal (if you can find them in the text, that is ok). Plot the single-sided or double-sided spectra for each signal. Include enough frequencies in the plots to adequately represent the frequency content of the signals. Plot partial sums of the Fourier series for...
Consider the function -1.0xs0 0cxs2 x: 2 + 2x-x": 2: (x) = (a) Find the Fourier series of the fun...
 Consider the function -1.0xs0 0cxs2 x: 2 + 2x-x": 2: (x) = (a) Find the Fourier series of the function(x) (b) Use any graphing software to plot the function ,f(x). (c) Graph the partial sums S (x) for N 1,2,3,5,10,20,50 in ONE graph (d) Analyse your results.
Consider the function -1.0xs0 0cxs2 x: 2 + 2x-x": 2: (x) = (a) Find the Fourier series of the function(x) (b) Use any graphing software to plot the function ,f(x). (c) Graph the...
Consider the function -1.0xs0 0cxs2 x: 2 + 2x-x": 2: (x) = (a) Find the Fourier series of the function(x) (b) Use any graphing software to plot the function ,f(x). (c) Graph the partial sums S (x) for N 1,2,3,5,10,20,50 in ONE graph (d) Analyse your results.
Consider the function -1.0xs0 0cxs2 x: 2 + 2x-x": 2: (x) = (a) Find the Fourier series of the function(x) (b) Use any graphing software to plot the function ,f(x). (c) Graph the...
For the function y 1-x for 0 s x s 1 Graph the function's 3 periods 1) Find its formulas for the Fourier series and Fourier coefficients 2) Write out the first three non-zero terms of the Four...
 For the function y 1-x for 0 s x s 1 Graph the function's 3 periods 1) Find its formulas for the Fourier series and Fourier coefficients 2) Write out the first three non-zero terms of the Fourier Series 3) 4) Graph the even extension of the function 5) Find the Fourier series and Fourier coefficients for the even extension 6) Write out the first three non-zero terms of the even Fourier series 7) Graph the odd extension of the...
Find a Fourier series representation in the form x(t)-xp ol + 〉 2 KI k ||...
 Find a Fourier series representation in the form x(t)-xp ol + 〉 2 KI k || cos(kat+ X | k |) of a. に! the impulse train and plot the spectrum of the series through the 5th harmonic. Write out the first five terms of the Fourier series of x(t) b. Now, find a Fourier series representation in the form x(t)=X[0] +Σ2k[k] cos(kay + X[k]) of the following (periodic) square wave に! 0 To To/2 To and plot the spectrum...
2. Find the Fourier series for the periodic function defined by if 0
 2. Find the Fourier series for the periodic function defined by if 0
12-21 FOURIER SERIES Find the Fourier series of the given function f(x), which is assumed to have...
 12-21 FOURIER SERIES Find the Fourier series of the given function f(x), which is assumed to have the period 2T. Show the details of your work. Sketch or graph the partial sums up to that including cos 5x and sin 5x. 9. f(x) -
12-21 FOURIER SERIES Find the Fourier series of the given function f(x), which is assumed to have the period 2T. Show the details of your work. Sketch or graph the partial sums up to that including...
12-21 FOURIER SERIES Find the Fourier series of the given function f(x), which is assumed to have the period 2T. Show the details of your work. Sketch or graph the partial sums up to that including cos 5x and sin 5x. 9. f(x) -
12-21 FOURIER SERIES Find the Fourier series of the given function f(x), which is assumed to have the period 2T. Show the details of your work. Sketch or graph the partial sums up to that including...
1. (a) Evaluate the Fourier coefficients a, an, ba for the function defined as f)-2 cos() for-π/2...
 1. (a) Evaluate the Fourier coefficients a, an, ba for the function defined as f)-2 cos() for-π/2 s sn2 and zero else over the period of 2T, do NOT use MATLAB or a calculator for integrations. All the steps should be shown. Write a few terms of the Fourier series expansion Plot 2 or 3 cycles of the Fourier series using MATLAB and verify whether the plot matches the given waveform Find Co and Cn and plot the amplitude spectrum...
I. Find the Fourier series of the following function with period 2π and accurately plot the...
 I. Find the Fourier series of the following function with period 2π and accurately plot the first three partial sums. [10 points f(x) A -π -π/2 0 π/2 π
 11.1 and 11.2 Fourier Series Q1 Find the Fourier series of the given function f(x), which is assumed to have the period 2π. Show the details of your work. Sketch or graph the partial sums up to that including cos 5x and sin 5x. Note: Plot the partial sum using MATLAB. Hint: Make use of your knowledge of the line equation to find f(x) from the given graph. -π 0
11.1 and 11.2 Fourier Series Q1 Find the Fourier series...
11.1 and 11.2 Fourier Series Q1 Find the Fourier series of the given function f(x), which is assumed to have the period 2π. Show the details of your work. Sketch or graph the partial sums up to that including cos 5x and sin 5x. Note: Plot the partial sum using MATLAB. Hint: Make use of your knowledge of the line equation to find f(x) from the given graph. -π 0
11.1 and 11.2 Fourier Series Q1 Find the Fourier series...
 Problem 2: A periodic signalxit) is shown below A =10, T-4 sec. -T Write a MATLAB script to plot the signal, using enough points to get a smooth curve. Compute the Fourier series coefficients for the signal (if you can find them in the text, that is ok). Plot the single-sided or double-sided spectra for each signal. Include enough frequencies in the plots to adequately represent the frequency content of the signals. Plot partial sums of the Fourier series for...
 A periodic signal, x(t) is shown below. A = 10, T-4 sec. -T Write a MATLAB script to plot the signal, using enough points to get a smooth curve. Compute the Fourier series coefficients for the signal (if you can find them in the text, that is ok). Plot the single-sided or double-sided spectra for each signal. Include enough frequencies in the plots to adequately represent the frequency content of the signals. Plot partial sums of the Fourier series for...
 Consider the function -1.0xs0 0cxs2 x: 2 + 2x-x": 2: (x) = (a) Find the Fourier series of the function(x) (b) Use any graphing software to plot the function ,f(x). (c) Graph the partial sums S (x) for N 1,2,3,5,10,20,50 in ONE graph (d) Analyse your results.
Consider the function -1.0xs0 0cxs2 x: 2 + 2x-x": 2: (x) = (a) Find the Fourier series of the function(x) (b) Use any graphing software to plot the function ,f(x). (c) Graph the...
Consider the function -1.0xs0 0cxs2 x: 2 + 2x-x": 2: (x) = (a) Find the Fourier series of the function(x) (b) Use any graphing software to plot the function ,f(x). (c) Graph the partial sums S (x) for N 1,2,3,5,10,20,50 in ONE graph (d) Analyse your results.
Consider the function -1.0xs0 0cxs2 x: 2 + 2x-x": 2: (x) = (a) Find the Fourier series of the function(x) (b) Use any graphing software to plot the function ,f(x). (c) Graph the...
 For the function y 1-x for 0 s x s 1 Graph the function's 3 periods 1) Find its formulas for the Fourier series and Fourier coefficients 2) Write out the first three non-zero terms of the Fourier Series 3) 4) Graph the even extension of the function 5) Find the Fourier series and Fourier coefficients for the even extension 6) Write out the first three non-zero terms of the even Fourier series 7) Graph the odd extension of the...
 Find a Fourier series representation in the form x(t)-xp ol + 〉 2 KI k || cos(kat+ X | k |) of a. に! the impulse train and plot the spectrum of the series through the 5th harmonic. Write out the first five terms of the Fourier series of x(t) b. Now, find a Fourier series representation in the form x(t)=X[0] +Σ2k[k] cos(kay + X[k]) of the following (periodic) square wave に! 0 To To/2 To and plot the spectrum...
 2. Find the Fourier series for the periodic function defined by if 0
 12-21 FOURIER SERIES Find the Fourier series of the given function f(x), which is assumed to have the period 2T. Show the details of your work. Sketch or graph the partial sums up to that including cos 5x and sin 5x. 9. f(x) -
12-21 FOURIER SERIES Find the Fourier series of the given function f(x), which is assumed to have the period 2T. Show the details of your work. Sketch or graph the partial sums up to that including...
12-21 FOURIER SERIES Find the Fourier series of the given function f(x), which is assumed to have the period 2T. Show the details of your work. Sketch or graph the partial sums up to that including cos 5x and sin 5x. 9. f(x) -
12-21 FOURIER SERIES Find the Fourier series of the given function f(x), which is assumed to have the period 2T. Show the details of your work. Sketch or graph the partial sums up to that including...
 1. (a) Evaluate the Fourier coefficients a, an, ba for the function defined as f)-2 cos() for-π/2 s sn2 and zero else over the period of 2T, do NOT use MATLAB or a calculator for integrations. All the steps should be shown. Write a few terms of the Fourier series expansion Plot 2 or 3 cycles of the Fourier series using MATLAB and verify whether the plot matches the given waveform Find Co and Cn and plot the amplitude spectrum...
 I. Find the Fourier series of the following function with period 2π and accurately plot the first three partial sums. [10 points f(x) A -π -π/2 0 π/2 π
Most questions answered within 3 hours.
-
MATLAB HW 11 problem using Switch Case and Input commands
Write a script file that calculates...
asked 14 minutes ago -
A college student is employed as a door-to-door newspaper
salesman. Historical data suggests that the student...
asked 29 minutes ago -
Considering gravitational time dilation, calculate the time that
passes in Earth’s surface while 1 hour passes...
asked 53 minutes ago -
Minitab Problem: Take the Lake Hume June rainfall data and find
use the processes outlined in...
asked 1 hour ago -
X Company is trying to decide whether to continue using old
equipment to make Product A...
asked 1 hour ago -
IN PYTHON ONLY !! Program 2: Re-work
program #5 (WeeklyHours) from the previous assignment such that...
asked 2 hours ago -
The average length of time between arrivals at a turnpike
toll-booth is 26 seconds. What is...
asked 4 hours ago -
(a) A piston at 6.1 atm contains a gas that occupies a volume of
3.5 L....
asked 5 hours ago -
Please answer true or false. Words
cannot be changed or added in to make it true...
asked 5 hours ago -
An empty test tube weighs 15.923 grams. Then,
MgCl2•6H2O is added into the test tube. After...
asked 5 hours ago -
Assume memory access is 10 units of time and disk access is
10000 units of time....
asked 5 hours ago -
1. Are all good samples random?
2. Magazines often report surveys giving statistics such as “63%...
asked 5 hours ago