
Homework Answers
MATLAB code is given below in bold letters.
clc;
close all;
clear all;
% define the signal parameters
A = 10;
T = 4;
w0 = 2*pi/T;
% define the symbolic variables
syms n t;
% define the signal
f = -A/T*t+A;
% evaluate the fourier series integral
an1 = 2/T*int(f*cos(n*w0*t),0,T);
bn1 = 2/T*int(f*sin(n*w0*t),0,T);
a0 = 1/T*int(f,0,T);
% obtain C by substituting n in c[n]
nmax = 100;
n = 1:nmax;
a = subs(an1);
b = subs(bn1);
% define the time vector
ts = 1e-1; % ts is sampling the
t = 0:ts:4*T-ts;
% directly plot the signal x(t)
t1 = 0:ts:4-ts;
x1 = -A/T*t1+A;
x = repmat(x1,1,4);
figure;
plot(t,x,'r','linewidth',2);grid on;
xlabel('time');ylabel('x(t)');
ylim([-5 15]);
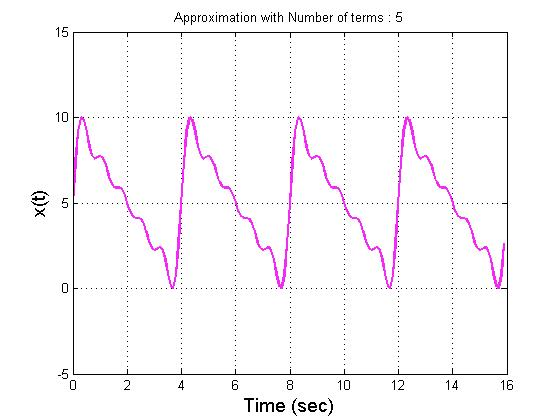
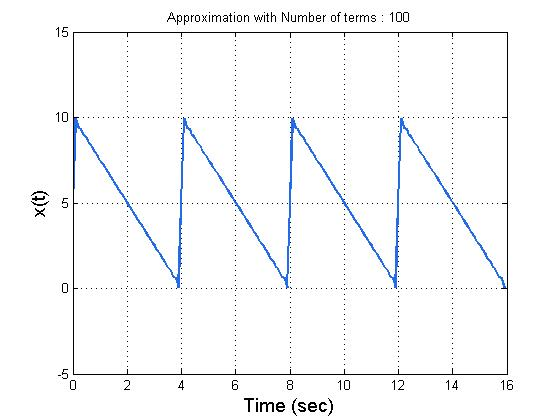
% Now fourier series reconstruction
N = [5 50 100];
for p = 1:length(N)
for i = 1:length(t)
for k = 1:N(p)
x(k,i) = a(k)*cos(k*w0*t(i)) + b(k)*sin(k*w0*t(i));
end
y(i) = a0+sum(x(:,i)); % Add DC term
end
figure;
plot(t,y,'color',rand(1,3),'linewidth',2); % Plot results
xlabel('Time (sec)','FontSize',14); grid on;
ylabel('x(t)','FontSize',14);ylim([-5 15]);
STRING = ['Approximation with Number of terms :
',num2str(N(p))];
title(STRING);
end


Add Answer to:
A periodic signal, x(t) is shown below. A = 10, T-4 sec. -T Write a MATLAB script to plot the sig...
Problem 2: A periodic signalxit) is shown below A =10, T-4 sec. -T Write a MATLAB script to plot ...
 Problem 2: A periodic signalxit) is shown below A =10, T-4 sec. -T Write a MATLAB script to plot the signal, using enough points to get a smooth curve. Compute the Fourier series coefficients for the signal (if you can find them in the text, that is ok). Plot the single-sided or double-sided spectra for each signal. Include enough frequencies in the plots to adequately represent the frequency content of the signals. Plot partial sums of the Fourier series for...
Use MATLAB to : ("j" is the imaginary number.) The term lo is the fundamental frequency...
 Use MATLAB to :
("j" is the imaginary number.) The term lo is the fundamental frequency of the periodic signal, 2/T, where T is the period. Frequencies nlo, where n is an integer, are the harmonics. This infinite sum is an exact representation of the original function. If we use a finite sum, where n goes from -N to N, we will get an approximation "X-(t)". In this problem we will calculate and plot the Fourier series representation of a...
Use MATLAB to :
("j" is the imaginary number.) The term lo is the fundamental frequency of the periodic signal, 2/T, where T is the period. Frequencies nlo, where n is an integer, are the harmonics. This infinite sum is an exact representation of the original function. If we use a finite sum, where n goes from -N to N, we will get an approximation "X-(t)". In this problem we will calculate and plot the Fourier series representation of a...
Please send the Matlab code 2. Compute the Fourier series coefficients for x(t) using MATLAB and...
 Please send the Matlab code
2. Compute the Fourier series coefficients for x(t) using MATLAB and plot the double-sided spectra up to the 10th harmonic. (20 points) 수 x(t) -10 10 20 30
Please send the Matlab code
2. Compute the Fourier series coefficients for x(t) using MATLAB and plot the double-sided spectra up to the 10th harmonic. (20 points) 수 x(t) -10 10 20 30
PLZ shows you Matlab Code X(t) 2 2 46 1. compute the Fourier Series coefficients, ck...
 PLZ shows you Matlab Code
X(t) 2 2 46 1. compute the Fourier Series coefficients, ck for the signal x(t) 2. plot magnitude of c and the phase of ck in separate plots (use subplot command) plot the Fourier Series coefficients for the square wave signal: ck(12/9) sinc(2"k/3)
PLZ shows you Matlab Code
X(t) 2 2 46 1. compute the Fourier Series coefficients, ck for the signal x(t) 2. plot magnitude of c and the phase of ck in separate plots (use subplot command) plot the Fourier Series coefficients for the square wave signal: ck(12/9) sinc(2"k/3)
Part 1: Exponential Fourier series The following MATLAB code calculates the exponential Fourier series coefficient for...
 Part 1: Exponential Fourier series The following MATLAB code calculates the exponential Fourier series coefficient for the signal x(t) shown in the figure below, plots it's double sided amplitude spectrum IDn l, double sided phase spectrem LDn, and the resulting signal xn(t). 4r 4a Periodic signal x(t) 1.1 Show that the complex Fourier Series Coefficients written as: D 1.2 Use the following Matlab to general the two sided spectral line. 1.3 Execute the Matlab code with To = 2π and...
During lab 4, we have seen numerical implementation of Fourier Series for periodic signals. As first part of this assignment, you need to write a Matlab function that would take an array representing...
During lab 4, we have seen numerical implementation of Fourier Series for periodic signals. As first part of this assignment, you need to write a Matlab function that would take an array representing a single period of a signal (x), corresponding time array (t), and return the Fourier Series coefficients (Ck) in exponential form. The function should also be able to take two (2) optional input arguments: number of Fourier coefficients (Nk) and plot option (p). Use the template ‘fourier_series_exp.m’...
Q1) For the periodic signals x() and ) shown below: x(t) YCO y(t) a) Find the exponential Fourier...
 Q1) For the periodic signals x() and ) shown below: x(t) YCO y(t) a) Find the exponential Fourier series for x(t) and y). b) Sketch the amplitude and phase spectra for signal x(). c) Use Parseval's theorem to approximate the power of the periodic signal x() by calculating the power of the first N harmonics, such that the strength of the Nth harmonic is 10% or more of the power of the DC component.
Q1) For the periodic signals x()...
Q1) For the periodic signals x() and ) shown below: x(t) YCO y(t) a) Find the exponential Fourier series for x(t) and y). b) Sketch the amplitude and phase spectra for signal x(). c) Use Parseval's theorem to approximate the power of the periodic signal x() by calculating the power of the first N harmonics, such that the strength of the Nth harmonic is 10% or more of the power of the DC component.
Q1) For the periodic signals x()...
1. We have a signal, x (t), with period of T - 2 second with the signal in one period given below: x(t)- ^x,(t+nT) wher...
 1. We have a signal, x (t), with period of T - 2 second with the signal in one period given below: x(t)- ^x,(t+nT) wherex,) 1-2 (t - ) Kt<1 n=-oo 0 1/2 (a) Find the Fourier series coefficients for this signal. That is, find the values of ak so that x (t) Hint: te-jwt teJwt dt (b) Write some MATLAB code which will plot the signal resulting from a truncated Fourier Series using the coefficients you calculated in part...
Let a periodic signal x(t) with a fundamental frequency ??e2? have a period 4.6 (a) Plot...
Let a periodic signal x(t) with a fundamental frequency ??e2? have a period 4.6 (a) Plot x(t), and indicate its fundamental period To (b) Compute the Fourier series coefficients of x(t) using their integral (c) (d) Answers: x(t) is periodic of fundamental period definition. Use the Laplace transform to compute the Fourier series coefficients Xk. Indicate how to compute the dc term. Suppose that y(t) = dx(t)/dt, find the Fourier transform of x(t) by means of the Fourier series coefficients...
2.For the periodic DT signal shown in Top, a) determine the Fourier Series Coefficients. b) Use...
 2.For the periodic DT signal shown in Top, a) determine the
Fourier Series Coefficients. b) Use MATLAB to generate a spectral
plot (magnitude plot and a separate phase plot). c) Use MATLAB to
generate and plot the signal as a DTFS expansion of the periodic
signal. Plot over an interval containing several periods. Make sure
to include the MATLAB code
x[ri] -9 63 3 9 12 n 1. For the periodic DT signal shown in Top, a) determine the Fourier...
2.For the periodic DT signal shown in Top, a) determine the
Fourier Series Coefficients. b) Use MATLAB to generate a spectral
plot (magnitude plot and a separate phase plot). c) Use MATLAB to
generate and plot the signal as a DTFS expansion of the periodic
signal. Plot over an interval containing several periods. Make sure
to include the MATLAB code
x[ri] -9 63 3 9 12 n 1. For the periodic DT signal shown in Top, a) determine the Fourier...
 Problem 2: A periodic signalxit) is shown below A =10, T-4 sec. -T Write a MATLAB script to plot the signal, using enough points to get a smooth curve. Compute the Fourier series coefficients for the signal (if you can find them in the text, that is ok). Plot the single-sided or double-sided spectra for each signal. Include enough frequencies in the plots to adequately represent the frequency content of the signals. Plot partial sums of the Fourier series for...
 Use MATLAB to :
("j" is the imaginary number.) The term lo is the fundamental frequency of the periodic signal, 2/T, where T is the period. Frequencies nlo, where n is an integer, are the harmonics. This infinite sum is an exact representation of the original function. If we use a finite sum, where n goes from -N to N, we will get an approximation "X-(t)". In this problem we will calculate and plot the Fourier series representation of a...
Use MATLAB to :
("j" is the imaginary number.) The term lo is the fundamental frequency of the periodic signal, 2/T, where T is the period. Frequencies nlo, where n is an integer, are the harmonics. This infinite sum is an exact representation of the original function. If we use a finite sum, where n goes from -N to N, we will get an approximation "X-(t)". In this problem we will calculate and plot the Fourier series representation of a...
 Please send the Matlab code
2. Compute the Fourier series coefficients for x(t) using MATLAB and plot the double-sided spectra up to the 10th harmonic. (20 points) 수 x(t) -10 10 20 30
Please send the Matlab code
2. Compute the Fourier series coefficients for x(t) using MATLAB and plot the double-sided spectra up to the 10th harmonic. (20 points) 수 x(t) -10 10 20 30
 PLZ shows you Matlab Code
X(t) 2 2 46 1. compute the Fourier Series coefficients, ck for the signal x(t) 2. plot magnitude of c and the phase of ck in separate plots (use subplot command) plot the Fourier Series coefficients for the square wave signal: ck(12/9) sinc(2"k/3)
PLZ shows you Matlab Code
X(t) 2 2 46 1. compute the Fourier Series coefficients, ck for the signal x(t) 2. plot magnitude of c and the phase of ck in separate plots (use subplot command) plot the Fourier Series coefficients for the square wave signal: ck(12/9) sinc(2"k/3)
 Part 1: Exponential Fourier series The following MATLAB code calculates the exponential Fourier series coefficient for the signal x(t) shown in the figure below, plots it's double sided amplitude spectrum IDn l, double sided phase spectrem LDn, and the resulting signal xn(t). 4r 4a Periodic signal x(t) 1.1 Show that the complex Fourier Series Coefficients written as: D 1.2 Use the following Matlab to general the two sided spectral line. 1.3 Execute the Matlab code with To = 2π and...
 Q1) For the periodic signals x() and ) shown below: x(t) YCO y(t) a) Find the exponential Fourier series for x(t) and y). b) Sketch the amplitude and phase spectra for signal x(). c) Use Parseval's theorem to approximate the power of the periodic signal x() by calculating the power of the first N harmonics, such that the strength of the Nth harmonic is 10% or more of the power of the DC component.
Q1) For the periodic signals x()...
Q1) For the periodic signals x() and ) shown below: x(t) YCO y(t) a) Find the exponential Fourier series for x(t) and y). b) Sketch the amplitude and phase spectra for signal x(). c) Use Parseval's theorem to approximate the power of the periodic signal x() by calculating the power of the first N harmonics, such that the strength of the Nth harmonic is 10% or more of the power of the DC component.
Q1) For the periodic signals x()...
 1. We have a signal, x (t), with period of T - 2 second with the signal in one period given below: x(t)- ^x,(t+nT) wherex,) 1-2 (t - ) Kt<1 n=-oo 0 1/2 (a) Find the Fourier series coefficients for this signal. That is, find the values of ak so that x (t) Hint: te-jwt teJwt dt (b) Write some MATLAB code which will plot the signal resulting from a truncated Fourier Series using the coefficients you calculated in part...
 2.For the periodic DT signal shown in Top, a) determine the
Fourier Series Coefficients. b) Use MATLAB to generate a spectral
plot (magnitude plot and a separate phase plot). c) Use MATLAB to
generate and plot the signal as a DTFS expansion of the periodic
signal. Plot over an interval containing several periods. Make sure
to include the MATLAB code
x[ri] -9 63 3 9 12 n 1. For the periodic DT signal shown in Top, a) determine the Fourier...
2.For the periodic DT signal shown in Top, a) determine the
Fourier Series Coefficients. b) Use MATLAB to generate a spectral
plot (magnitude plot and a separate phase plot). c) Use MATLAB to
generate and plot the signal as a DTFS expansion of the periodic
signal. Plot over an interval containing several periods. Make sure
to include the MATLAB code
x[ri] -9 63 3 9 12 n 1. For the periodic DT signal shown in Top, a) determine the Fourier...
Most questions answered within 3 hours.
-
suppose there is a normally distributed population with a mean of
250 and a standard deviation...
asked 27 minutes ago -
Question Three
Suppose you as project manager are using the Waterfall
development methodology on a large...
asked 1 hour ago -
Which statement is not true about welfare in Canada?
A.Benefits typically vary based on one's ability...
asked 1 hour ago -
Please help me with FLOWCHART and UML diagram for class,
thank you!
#include <iostream>
#include <fstream>...
asked 2 hours ago -
3. Describe the “logic circuit” of the Lac operon. Which
proteins are bound or not to...
asked 2 hours ago -
Ayesha’s adjusted gross income is $60,000 in 2019. She donated a
piece of artwork with a...
asked 2 hours ago -
For Dijkstra’s shortest path algorithm:
a. Give the Big-O time for Dijkstra’s shortest path algorithm
and...
asked 3 hours ago -
Phosphorus violates the 'octet rule' in biological molecules,
forming more covalent bonds than expected based on...
asked 3 hours ago -
A 1.3 eV electron has a 10-4 probability of tunneling
through a 2.4 eV potential barrier....
asked 3 hours ago -
What is the one ingredient that is common to being successful
with all stakeholders?
profit
trust...
asked 3 hours ago -
Write an assembly language 32 bit program that reads in lines of
text by a .txt...
asked 3 hours ago -
what is the density ( in g/L) of hydrogen gas at 29 degrees C and a...
asked 3 hours ago